Monitoring Linux Network Stack
This post shows how to collecte metrics from your Linux network stack (with bash scripts), and monitoring the stack status with Prometheus and Grafana.
This post assumes you have read through the following posts (kernel 3.13 + intel 1Gbps NIC driver):
- Monitoring and Tuning the Linux Networking Stack: Receiving Data
- Monitoring and Tuning the Linux Networking Stack: Sending Data
Or my updated versions (kernel 5.10 + mellanox 25Gbps NIC driver) if you can read Chinese:
- Linux 网络栈原理、监控与调优:前言
- Linux 中断(IRQ/softirq)基础:原理及内核实现
- Linux 网络栈接收数据(RX):原理及内核实现
- Linux 网络栈接收数据(RX):配置调优
Besides, some basic understandings of Prometheus and Grafana are needed.
- 1. NIC
- 2. Hardware Interrupts
- 3. Software Interrupts (softirq)
- 4. Kernel Processing Drops
- 5. L3 statistics (IPv4)
- 6. L4 statistics (TCP)
- 7. L4 statistics (UDP)
- 8. Top N nodes
- 9. More metrics
- Appendix
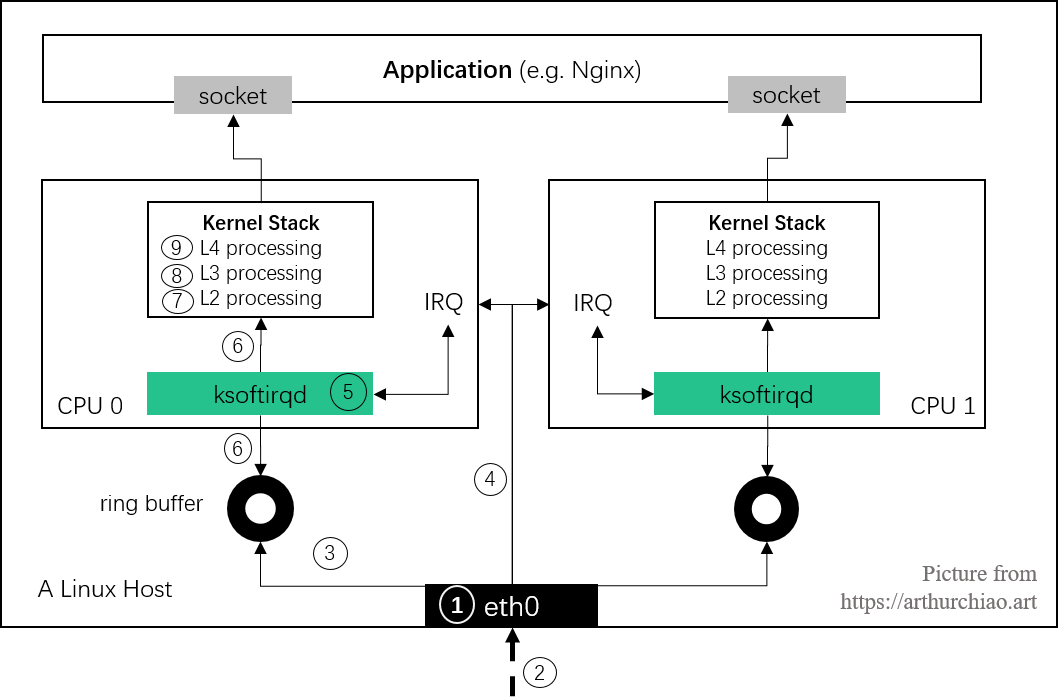
Fig. Steps of Linux kernel receiving data process and the corresponding chapters in this post
1. NIC
1.1 Data sources
ethtool -S
$ sudo ethtool -S eth0
NIC statistics:
     rx_packets: 597028087
     tx_packets: 5924278060
     rx_bytes: 112643393747
     tx_bytes: 990080156714
     rx_broadcast: 96
     tx_broadcast: 116
     rx_multicast: 20294528
     ....
Note that depending on specific NICs/drivers, some of the metrics may be updated in the kernel code (software), some may be in hardware. Refer to the datasheets of the your NICs and the corresponding drivers if needed.
/proc/net/dev
/proc/net/dev also provides some network device level statistics:
$ cat /proc/net/dev
Inter-|   Receive                                                |  Transmit
 face |bytes    packets errs drop fifo frame compressed multicast|bytes  packets errs drop fifo colls carrier compressed
  eth0: 152214  9700    0    2    0     0          0    203860 9905984   62604    0    0    0     0       0          0
    lo: 463836  57535   0    0    0     0          0         0 4263836   18535    0    0    0     0       0          0
Actually this is only a subnet of /sys/class/net/<nic>/statistics, as introduced in the
below section.
/sys/class/net/<nic>/statistics
Statistics from sysfs provides an uppper layer view of the NIC RX/TX stats.
NIC stats from /sys/class/net/<nic>/statistics:
$ ls /sys/class/net/eth0/statistics
collisions     rx_dropped        rx_missed_errors   tx_bytes           tx_fifo_errors
multicast      rx_errors         rx_nohandler       tx_carrier_errors  tx_heartbeat_errors
rx_bytes       rx_fifo_errors    rx_over_errors     tx_compressed      tx_packets
rx_compressed  rx_frame_errors   rx_packets         tx_dropped         tx_window_errors
rx_crc_errors  rx_length_errors  tx_aborted_errors  tx_errors

$ cat /sys/class/net/eth0/statistics/rx_crc_errors
0
Again, look into the spcific driver code if you’d like to ensure when and where a specific counter is updated.
1.2 Metrics
We will arrange our metrics in Prometheus format:
$ cat collect-network-stats.sh
#!/bin/bash

PREFIX="network"

nic_stats_output() {
    NIC=$1
    METRIC=$PREFIX"_nic_stats";

    for f in $(ls /sys/class/net/$NIC/statistics/); do
        TAGS="{\"nic\":\"$NIC\",\"type\":\"$f\"}";
        VAL=$(cat /sys/class/net/$NIC/statistics/$f 2>/dev/null);
        echo $METRIC$TAGS $VAL;
    done
}

nic_stats_output eth0
nic_stats_output eth1
Test:
$ ./collect-network-stats.sh
network_nic_stats{"nic":"eth0","type":"collisions"} 0
network_nic_stats{"nic":"eth0","type":"multicast"} 17775912
network_nic_stats{"nic":"eth0","type":"rx_bytes"} 322700688616
network_nic_stats{"nic":"eth0","type":"rx_compressed"} 0
network_nic_stats{"nic":"eth0","type":"rx_crc_errors"} 0
network_nic_stats{"nic":"eth0","type":"rx_dropped"} 0
network_nic_stats{"nic":"eth0","type":"rx_errors"} 0
...
1.3 Panels
Push the metrics into your prometheus server, or, configure your prometheus to pull this data, we could create a panel like this:
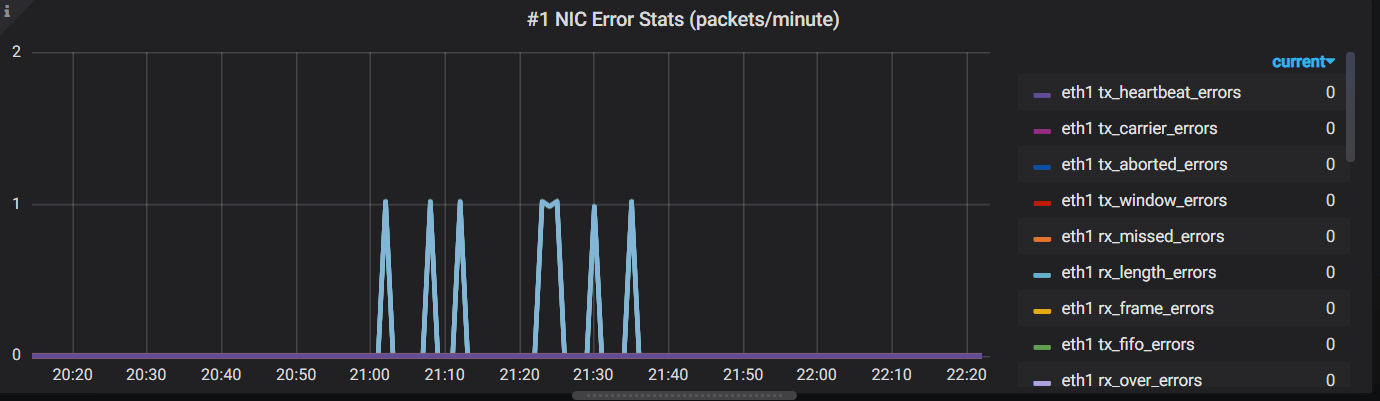
Where, the Grafane query is:
avg(irate(network_nic_stats{host="$hostname"})*60) by (nic, type)
Note that our collecting agent automatically added a new tag host=<hostname>
to all the metrics, so we could filter the metrics with host="$hostname".
2. Hardware Interrupts
2.1 Data source (/proc/interrupts)
Information included:
- IRQ->CPU mapping
- Total count of specific interrupts (e.g. RX/TX interrupts, timer interrupts), on specific CPU
- IRQ handler type and name
Note that these are interrupt counts, not number of packets - for example, if Interrupt Coalescing is enabled, a batch of packets will trigger only one IRQ.
$ cat /proc/interrupts
         CPU0     CPU1       CPU2     ...    CPU30    CPU31
 ...

 139:       0        0          0     ...        0        0  IR-PCI-MSI 1572864-edge      eth0-tx-0
 140:       0        0          0     ...        0        0  IR-PCI-MSI 1572865-edge      eth0-rx-1
 141:       0        0          0     ...        0        0  IR-PCI-MSI 1572866-edge      eth0-rx-2
 142:       0        0     308405     ...        0        0  IR-PCI-MSI 1572867-edge      eth0-rx-3
 143:       0        0          0     ...        0        0  IR-PCI-MSI 1572868-edge      eth0-rx-4
 144:       0        0          4     ...        0        0  IR-PCI-MSI 1574912-edge      eth1-tx-0
 145:       0        0          0     ...        0        0  IR-PCI-MSI 1574913-edge      eth1-rx-1
 146:       0       38        673     ...        0        0  IR-PCI-MSI 1574914-edge      eth1-rx-2
 147:       0    75604          0     ...        0        0  IR-PCI-MSI 1574915-edge      eth1-rx-3
 148:       0     3086     824199     ...        0        0  IR-PCI-MSI 1574916-edge      eth1-rx-4
 ...
2.2 Metric
Add this code snippet to our script:
interrupts_output() {
    PATTERN=$1
    METRIC=$PREFIX"_interrupts_by_cpu"

    egrep "$PATTERN" /proc/interrupts | awk -v metric=$METRIC \
        '{ for (i=2;i<=NF-3;i++) sum[i]+=$i;}
         END {
               for (i=2;i<=NF-3; i++) {
                   tags=sprintf("{\"cpu\":\"%d\"}", i-2);
                   printf(metric tags " " sum[i] "\n");
               }
         }'

    METRIC=$PREFIX"_interrupts_by_queue"
    egrep "$PATTERN" /proc/interrupts | awk -v metric=$METRIC \
        '{ for (i=2;i<=NF-3; i++)
               sum+=$i;
               tags=sprintf("{\"queue\":\"%s\"}", $NF);
               printf(metric tags " " sum "\n");
               sum=0;
         }'
}

# interface patterns
# eth: intel
# mlx: mellanox
interrupts_output "eth|mlx"
$ ./collect-network-stats.sh
network_interrupts_by_cpu{"cpu":"0"} 0
network_interrupts_by_cpu{"cpu":"1"} 6078192
network_interrupts_by_cpu{"cpu":"2"} 85118785
...
network_interrupts_by_queue{"queue":"eth0-tx-0"} 190533384
network_interrupts_by_queue{"queue":"eth0-rx-1"} 26873848
network_interrupts_by_queue{"queue":"eth0-rx-2"} 23715431
network_interrupts_by_queue{"queue":"eth0-rx-3"} 87702361
...
network_interrupts_by_queue{"queue":"eth1-rx-4"} 3119407
2.3 Panels
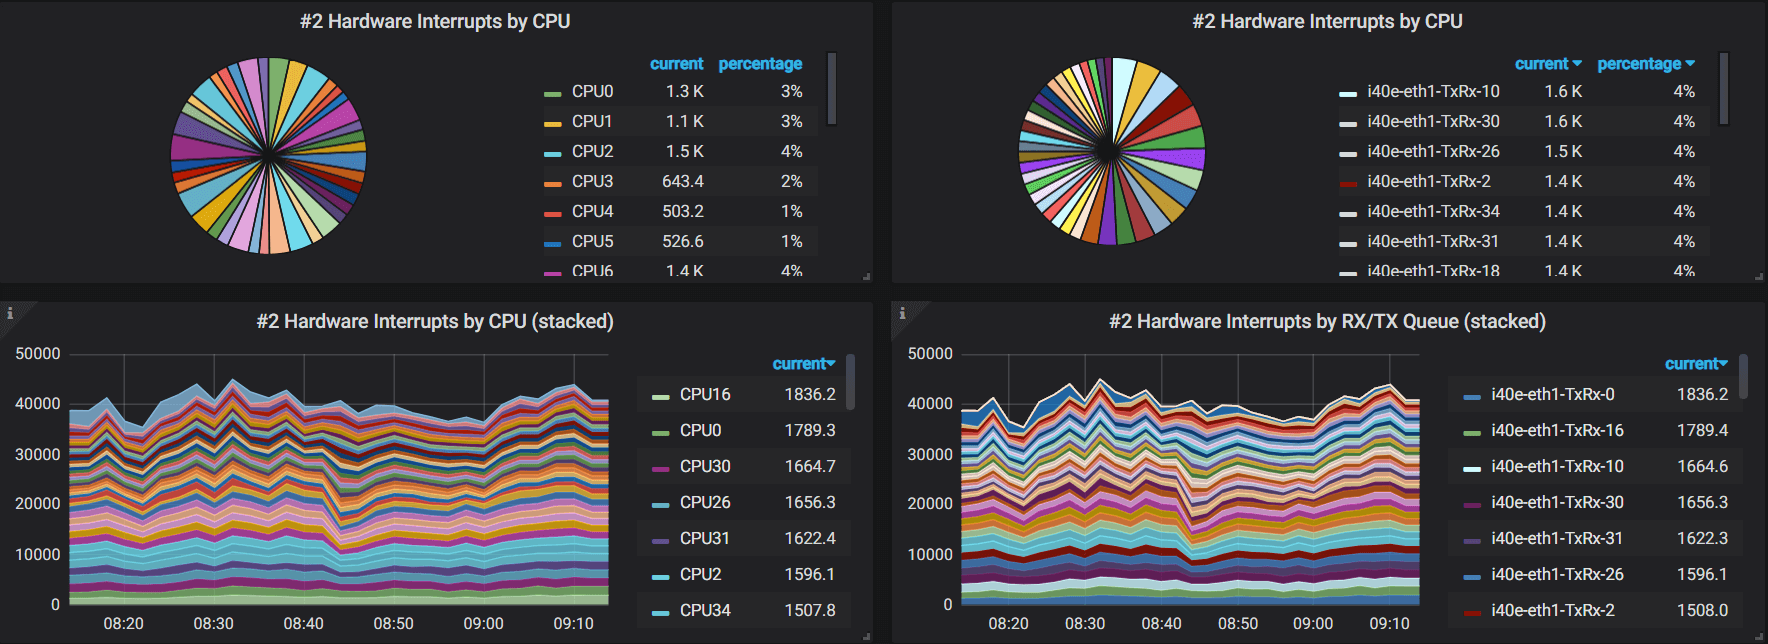
avg(irate(network_interrupts_by_cpu{host=~"$hostname"})) by (cpu)
avg(irate(network_interrupts_by_queue{host=~"$hostname"})) by (queue)
3. Software Interrupts (softirq)
3.1 Data source (/proc/softirqs)
$ cat /proc/softirqs
                    CPU0       CPU1    ...      CPU62      CPU63
          HI:          1          0    ...         0          0
       TIMER:   20378862    2149097    ...         0          0
      NET_TX:          5          1    ...         0          0
      NET_RX:       1179       1868    ...         0          0
       BLOCK:      88034      33007    ...         0          0
    IRQ_POLL:          0          0    ...         0          0
     TASKLET:         22          0    ...         0          0
       SCHED:   13906041    1474443    ...         0          0
     HRTIMER:          0          0    ...         0          0
         RCU:   12121418    1964562    ...         0          0
3.2 Metric
softirqs_output() {
    METRIC=$PREFIX"_softirqs"

    for dir in "NET_RX" "NET_TX"; do
        grep $dir /proc/softirqs | awk -v metric=$METRIC -v dir=$dir \
            '{ for (i=2;i<=NF-1;i++) {
                   tags=sprintf("{\"cpu\":\"%d\", \"direction\": \"%s\"}", i-2, dir); \
                   printf(metric tags " " $i "\n"); \
               }
             }'
    done
}

softirqs_output
$ ./collect-network-stats.sh
network_softirqs{"cpu":"0", "direction": "NET_RX"} 196082
network_softirqs{"cpu":"1", "direction": "NET_RX"} 119888284
network_softirqs{"cpu":"2", "direction": "NET_RX"} 189840914
network_softirqs{"cpu":"3", "direction": "NET_RX"} 114621858
network_softirqs{"cpu":"4", "direction": "NET_RX"} 1453599
network_softirqs{"cpu":"5", "direction": "NET_RX"} 192694791
network_softirqs{"cpu":"6", "direction": "NET_RX"} 49328487
...
3.3 Panels
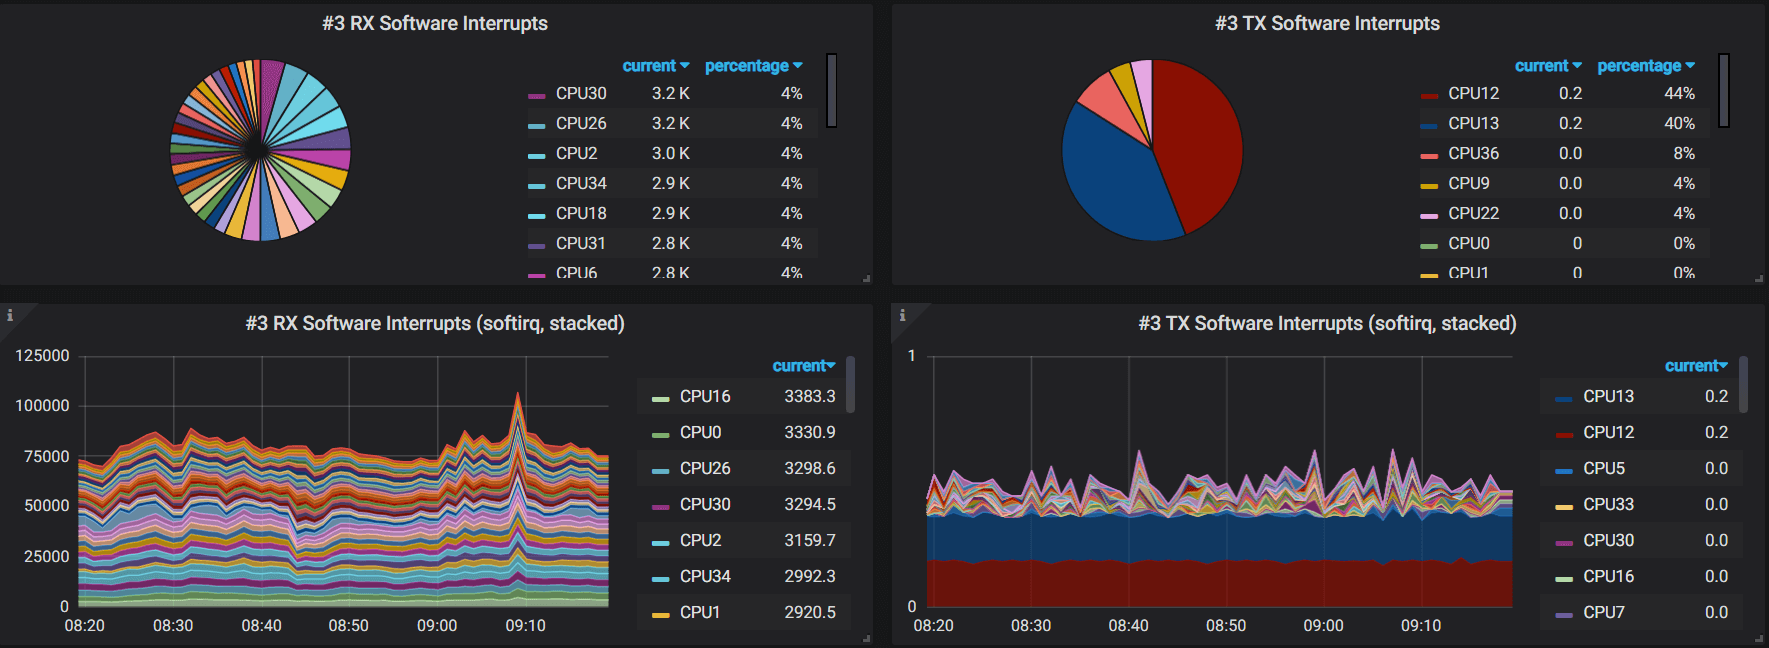
Grafana queries:
avg(irate(network_interrupts_by_cpu{host="$hostname",direction="NET_RX"})) by (cpu)
avg(irate(network_interrupts_by_cpu{host="$hostname",direction="NET_TX"})) by (cpu)
4. Kernel Processing Drops
4.1 Data source (/proc/net/softnet_stat)
$ cat /proc/net/softnet_stat
00049007 00000000 00000000 00000000 00000000 00000000 00000000 00000000 00000000 00000000 00000000
074c3e6e 00000000 00000000 00000000 00000000 00000000 00000000 00000000 00000000 00000000 00000000
0c98d81b 00000000 00000000 00000000 00000000 00000000 00000000 00000000 00000000 00000000 00000000
07212d42 00000000 00000000 00000000 00000000 00000000 00000000 00000000 00000000 00000000 00000000
0018ad7c 00000000 00000000 00000000 00000000 00000000 00000000 00000000 00000000 00000000 00000000
00037314 00000000 00000002 00000000 00000000 00000000 00000000 00000000 00000000 00000000 00000000
...
4.2 Metric
softnet_stat_output() {
    TYP=$1
    IDX=$2

    METRIC=$PREFIX"_softnet_stat"

    VAL=$(cat /proc/net/softnet_stat | awk -v IDX="$IDX" '{sum+=strtonum("0x"$IDX);} END{print sum;}')
    TAGS="{\"type\":\"$TYP\"}";

    echo $METRIC$TAGS $VAL;
}

# Format of /proc/net/softnet_stat:
#
# column 1  : received frames
# column 2  : dropped
# column 3  : time_squeeze
# column 4-8: all zeros
# column 9  : cpu_collision
# column 10 : received_rps
# column 11 : flow_limit_count
#
# http://arthurchiao.art/blog/tuning-stack-rx-zh/
softnet_stat_output "dropped" 2
softnet_stat_output "time_squeeze" 3
softnet_stat_output "cpu_collision" 9
softnet_stat_output "received_rps" 10
softnet_stat_output "flow_limit_count" 11
Run:
$ ./collect-network-stats.sh
network_softnet_stat{"type":"dropped"} 0
network_softnet_stat{"type":"time_squeeze"} 4
network_softnet_stat{"type":"cpu_collision"} 0
network_softnet_stat{"type":"received_rps"} 0
network_softnet_stat{"type":"flow_limit_count"} 0
4.3 Panel
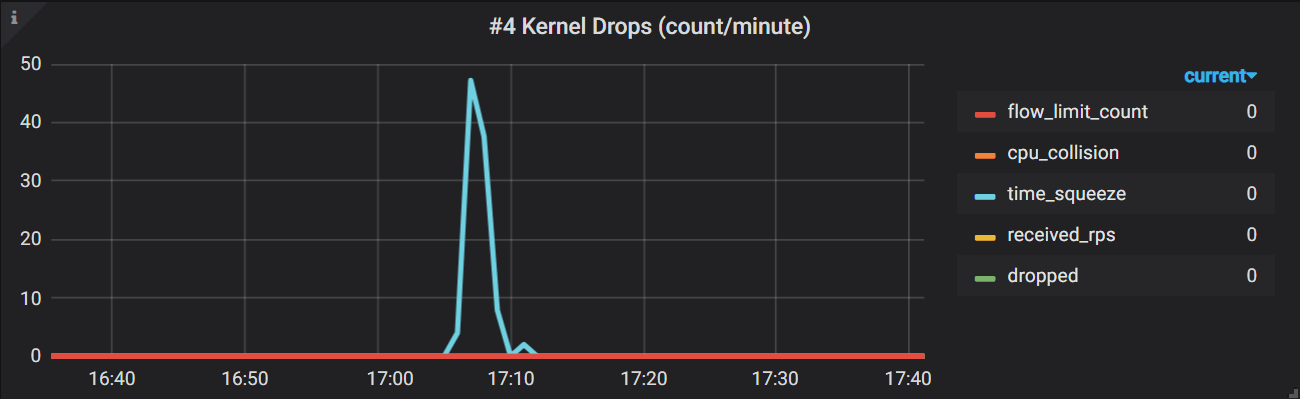
Grafana queries:
avg(irate(network_softnet_stat{host="$hostname"})) by (type)
5. L3 statistics (IPv4)
5.1 Data source (/proc/net/snmp)
$ cat /proc/net/snmp
Ip: Forwarding DefaultTTL InReceives InHdrErrors InAddrErrors ForwDatagrams InUnknownProtos InDiscards InDelivers OutRequests OutDiscards OutNoRoutes ReasmTimeout ReasmReqds ReasmOKs ReasmFails FragOKs FragFails FragCreates
Ip: 1 64 25922988125 0 0 15771700 0 0 25898327616 22789396404 12987882 51 1 10129840 2196520 1 0 0 0
...
Fields:
// https://github.com/torvalds/linux/blob/v5.10/include/uapi/linux/snmp.h#L21

/* ipstats mib definitions */

enum {
  IPSTATS_MIB_NUM = 0,
  IPSTATS_MIB_INPKTS,       /* InReceives */
  IPSTATS_MIB_INOCTETS,     /* InOctets */
  IPSTATS_MIB_INDELIVERS,   /* InDelivers */
  ...
6. L4 statistics (TCP)
6.1 Data source
$ netstat -s
Ip:
    397147220 total packets received
    621 with invalid headers
    1 with invalid addresses
    16591642 forwarded
...
Tcp:
    53687405 active connections openings
    449771 passive connection openings
    52888864 failed connection attempts
    66565 connection resets received
...
TcpExt:
    18 ICMP packets dropped because they were out-of-window
    4 ICMP packets dropped because socket was locked
    643745 TCP sockets finished time wait in fast timer
    8 packets rejects in established connections because of timestamp
...
6.2 Metric
netstat_output() {
    PATTERN=$1
    ARG_IDX=$2

    METRIC=$PREFIX"_tcp"
    VAL=$(netstat -s | grep "$PATTERN" | awk -v i=$ARG_IDX '{print $i}')

    # generate "type" string with prefix and pattern
    #
    # 1. replace whitespaces with underlines
    # 2. remove trailing dollar symbol ('$') if there is
    #
    # e.g. "fast retransmits$" -> "fast_retransmits"
    #
    TYP=$(echo "$PATTERN" | tr ' ' '_' | sed 's/\$//g')

    TAGS="{\"type\":\"$TYP\"}";
    echo $METRIC$TAGS $VAL;
}

netstat_output "segments retransmited" 1
netstat_output "TCPLostRetransmit" 2
netstat_output "fast retransmits$" 1
netstat_output "retransmits in slow start" 1
netstat_output "classic Reno fast retransmits failed" 1
netstat_output "TCPSynRetrans" 2

netstat_output "bad segments received" 1
netstat_output "resets sent$" 1
netstat_output "connection resets received$" 1

netstat_output "connections reset due to unexpected data$" 1
netstat_output "connections reset due to early user close$" 1
Run:
$ ./collect-network-stats.sh
network_tcp{"type":"segments_retransmited"} 618183
network_tcp{"type":"TCPLostRetransmit"} 133668
network_tcp{"type":"fast_retransmits"} 45745
network_tcp{"type":"retransmits_in_slow_start"} 62977
network_tcp{"type":"classic_Reno_fast_retransmits_failed"} 418
network_tcp{"type":"TCPSynRetrans"} 175919
network_tcp{"type":"bad_segments_received"} 399
network_tcp{"type":"resets_sent"} 234094
network_tcp{"type":"connection_resets_received"} 66553
network_tcp{"type":"connections_reset_due_to_unexpected_data"} 93589
network_tcp{"type":"connections_reset_due_to_early_user_close"} 6522
6.3 Panel
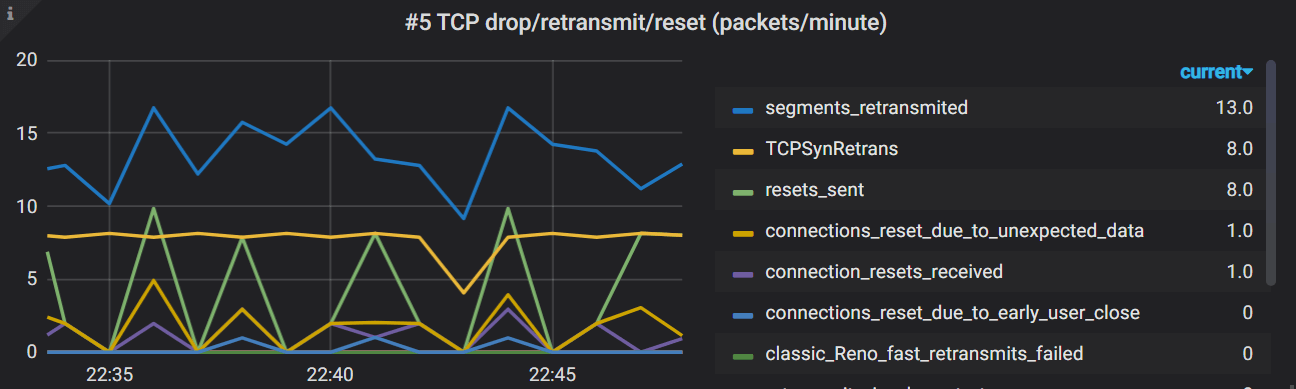
Grafana queries:
avg(irate(network_tcp{host="$hostname"})*60) by (type)
7. L4 statistics (UDP)
7.1 Data source
/proc/net/snmp
$ cat /proc/net/snmp
...
Udp: InDatagrams NoPorts InErrors OutDatagrams RcvbufErrors SndbufErrors InCsumErrors IgnoredMulti
Udp: 3251496 356 0 3251774 0 0 0 0
UdpLite: InDatagrams NoPorts InErrors OutDatagrams RcvbufErrors SndbufErrors InCsumErrors IgnoredMulti
UdpLite: 0 0 0 0 0 0 0 0
/proc/net/udp
$ cat /proc/net/udp
  sl  local_address rem_address   st tx_queue rx_queue tr tm->when retrnsmt   uid  timeout inode ref pointer drops
52544: 3F40160A:007B 00000000:0000 07 00000000:00000000 00:00000000 00000000    38        0 190750 2 000000009f44ff46 0
52544: 016C000A:007B 00000000:0000 07 00000000:00000000 00:00000000 00000000    38        0 85972 2 00000000ab7f749c 0
52544: 7136060A:007B 00000000:0000 07 00000000:00000000 00:00000000 00000000    38        0 59580 2 000000004c64a4a4 0
52544: 0100007F:007B 00000000:0000 07 00000000:00000000 00:00000000 00000000     0        0 55725 2 0000000051afcbdd 0
52544: 00000000:007B 00000000:0000 07 00000000:00000000 00:00000000 00000000     0        0 55719 2 000000008c653c2d 0
The first line describes each of the fields in the lines following:
sl: Kernel hash slot for the socketlocal_address: Hexadecimal local address of the socket and port number, separated by :.rem_address: Hexadecimal remote address of the socket and port number, separated by :.st: The state of the socket. Oddly enough, the UDP protocol layer seems to use some TCP socket states. In the example above, 7 is TCP_CLOSE.tx_queue: The amount of memory allocated in the kernel for outgoing UDP datagrams.rx_queue: The amount of memory allocated in the kernel for incoming UDP datagrams.tr, tm->when, retrnsmt: These fields are unused by the UDP protocol layer.uid: The effective user id of the user who created this socket.timeout: Unused by the UDP protocol layer.inode: The inode number corresponding to this socket. You can use this to help you determine which user process has this socket open. Check /proc/[pid]/fd, which will contain symlinks to socket[:inode].ref: The current reference count for the socket.pointer: The memory address in the kernel of the struct sock.drops: The number of datagram drops associated with this socket. Note that this does not include any drops related to sending datagrams (on corked UDP sockets or otherwise); this is only incremented in receive paths as of the kernel version examined by this blog post.
Printing code: net/ipv4/udp.c.
8. Top N nodes
Top-N nodes for some specific metrics:
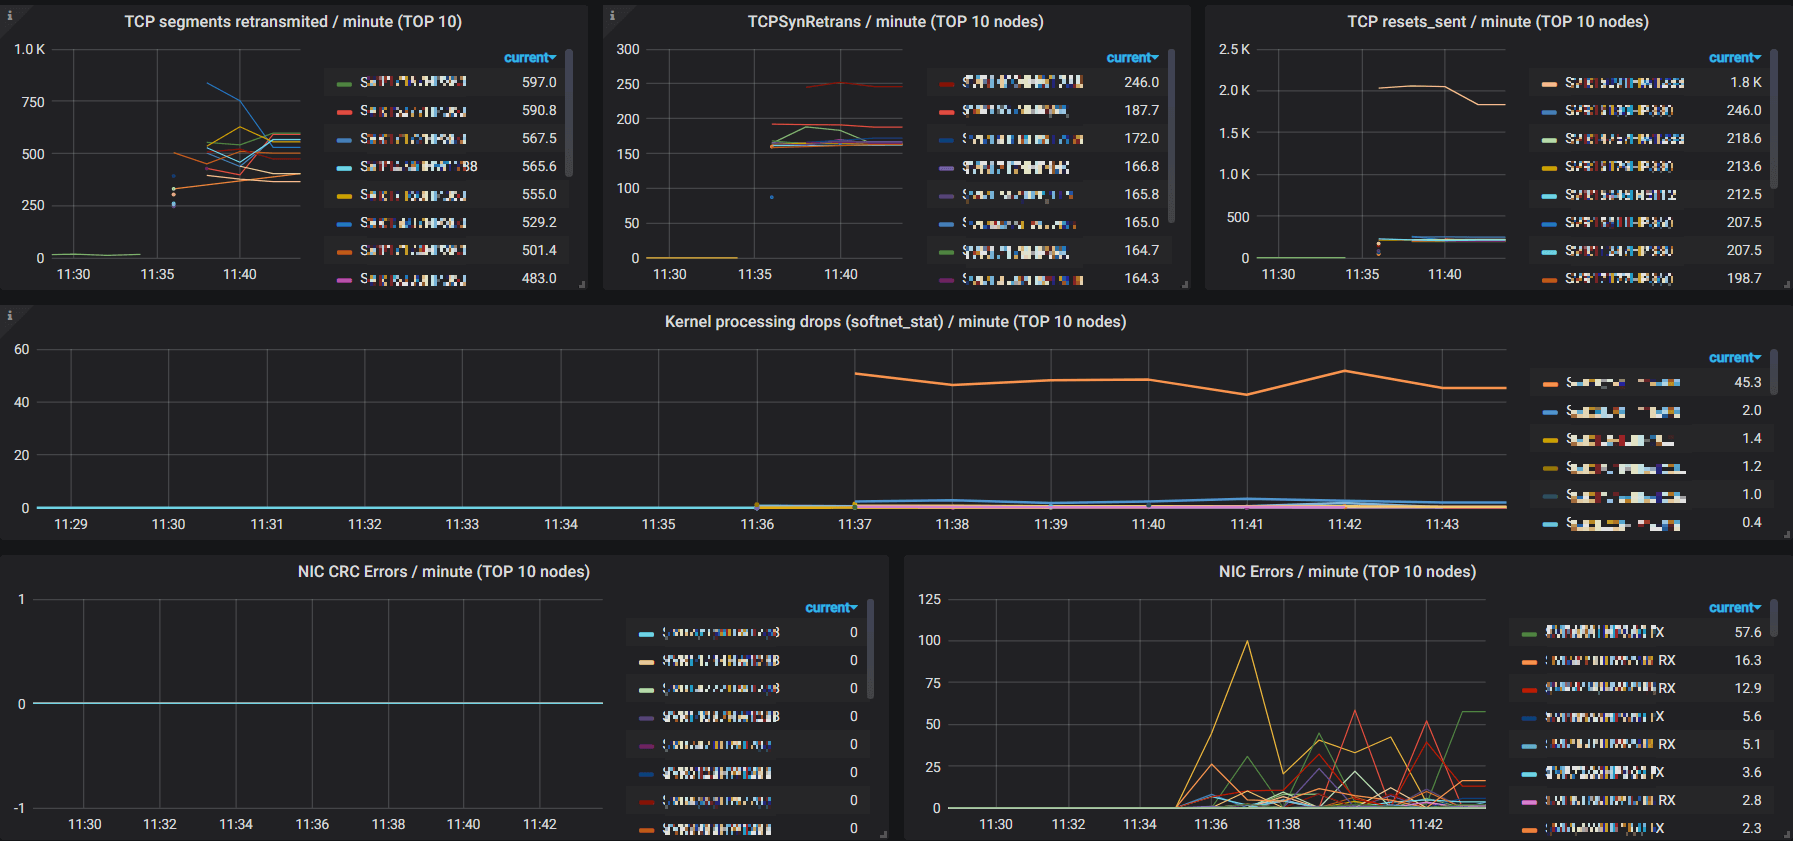
This is quite helpful for detecting problematic nodes.
Queries for these panels are very similar, we list some here:
topk(10, avg(irate(k8s.node.network.tcp{type="segments_retransmited"})*60) by (host))topk(10, avg(irate(k8s.node.network.tcp{type="TCPSynRetrans"})*60) by (host))topk(10, avg(irate(k8s.node.network.nic.errors{type=~'rx_.*'})*60) by (host))topk(10, avg(irate(k8s.node.network.nic.errors{type=~'tx_.*'})*60) by (host))
9. More metrics
This post serves as a introductory guide for how to monitoring you network stack with Prometheus and Grafana.
Actually there are more metrics than we have shown in the above, such as, you could monitor the NIC bandwidth with metrics from NIC statistics:
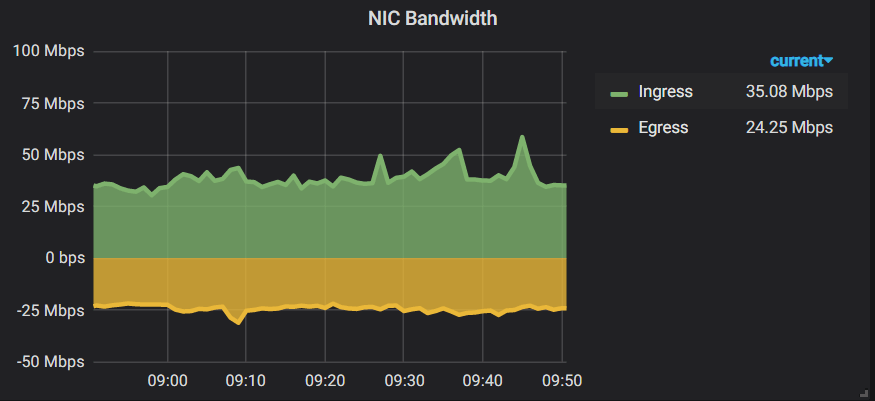
Besides, you could also configure alerting rules on Grafana panels, e.g. alerting when NIC errors exceeds a pre defined threshold.