[笔记] 《Systems Performance: Enterprise and the Cloud》(Prentice Hall, 2013)
本文是阅读 Brendan Gregg 所著的 Systems Performance: Enterprise and the Cloud 一书(中文版名为《性能之巅》)时所做的笔记。
本文内容仅供学习交流,如有侵权立即删除。
- 1. 绪论
- 2. 方法论
- 3. 操作系统
- 4. 观测工具(Observability Tools)
- 5. Applications
- 6. CPU
- 7. Memory
- 8. File Systems
- 9. Disk
- 10. Network
1. 绪论
DTrace 是第一个用于生产环境的动态跟踪(dynamic tracing)工具,
- Sun 公司开发,随 2015 年 Solaris 10 首发
- 支持对内核态和用户态程序进行静态跟踪和动态跟踪
DTrace 之前,系统跟踪常常使用静态探测(static probes),
- 内核和其他软件中的一些探测点(instrumentation points)
案例研究:Slow Disk
现象:磁盘操作变慢,但 CPU、网络等正常,业务查询量也并未增加。
排查:
mpstat,iostat查看磁盘 IO- 随机访问、连续访问?
- 文件系统碎片?
- 文件系统页缓存未命中?查看命中率
- 文件缓存大小?
最终原因:另一个程序占用了大量内存,导致本来可用于文件系统缓存的内存空间变小 ,命中率变低,磁盘 IO 升高。
2. 方法论
2.3.1 延迟
以 3.3 GHz processor 为例,
- 访问一次寄存器需要一个时钟周期,
0.3 ns - 作为对比,光传播
1米所需的时间是3.4 ns
表 2-1. 系统延迟的时间尺度
| Event | Latency | Scaled |
|---|---|---|
| 1 CPU cycle | 0.3 ns |
1 秒 |
| L1 cache | 0.9 ns |
3 秒 |
| L2 cache | 2.8 ns |
9 秒 |
| L3 cache | 12.9 ns |
43 秒 |
| 内存 (DRAM, from CPU) | 120 ns |
6 分 |
| SSD | 50-150 us |
2-6 天 |
| 旋转磁盘 | 1-10 ms |
1-12 月 |
| 互联网: 旧金山 -> 纽约 | 40 ms |
4 年 |
| 互联网: 旧金山 -> 英国 | 81 ms |
8 年 |
| 互联网: 旧金山 -> 澳洲 | 183 ms |
19 年 |
| TCP 重传 | 1-3 s |
105-317 年 |
| SCSI command timeout | 30 s |
3000 年 |
| 物理系统重启 | 5 m |
32000 年 |
2.5 方法论
2.5.1 Streetlight Anti-Method
某天晚上,警察看到一个醉汉在路灯下找东西,他声称自己的钥匙丢了。警察帮忙找了 一会也没找到,然后问道:“你确定是丢在这里,路灯下面?”醉汉答:“不确定,但这里光线最好。”
这就相当于登到机器之后先执行 top:并不是因为此时
top 是最优的,而是 暂时也想不到其他更好的工具。
2.5.9 USE(利用率/饱和度/错误数)
- 利用率(Utilization): 例如,CPU 利用率
90% - 饱和度(Saturation): 用 wait-queue length 衡量,例如,CPU 的平均
run-queue length是 4 - 错误数(Errors): 例如网卡有 50 个丢包
对 CPU、内存、网络、存储等应用 USE 方法: Linux Trouble Shooting Cheat Sheet 或原书附录 A。
3. 操作系统
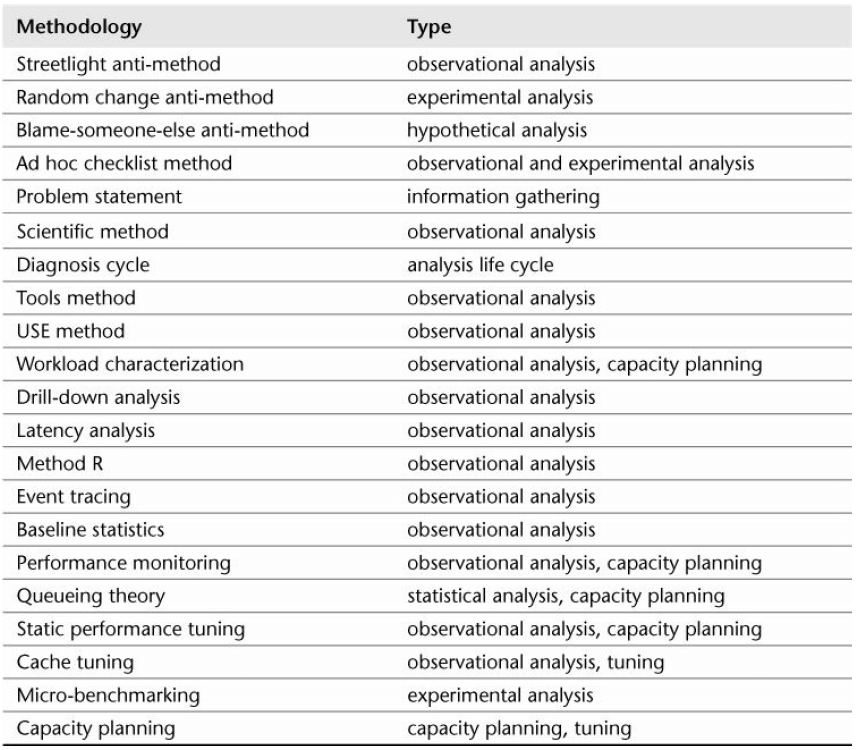
3.2.4 中断优先级(IPL)
interrupt priority level (IPL) represents the priority of the currently active interrupt service routine.
串行 I/O 的中断优先级很高,因为它们的硬件缓存很小,很容易溢出。
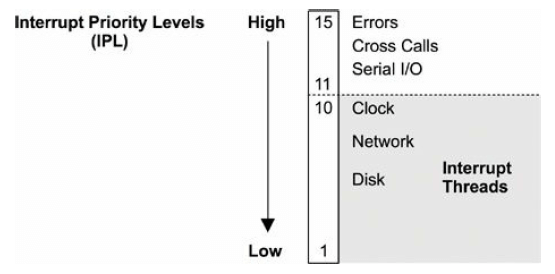
3.2.5 进程
从某种程度来说,进程像是一台虚拟的早期计算机(a virtual early computer): 里面只运行一个程序,并且这个程序有自己独立的
- 地址空间
- 文件描述符
- 线程
- 寄存器
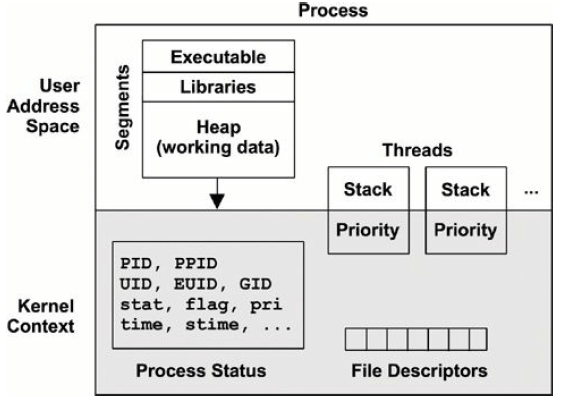
图 3-8. Process environment
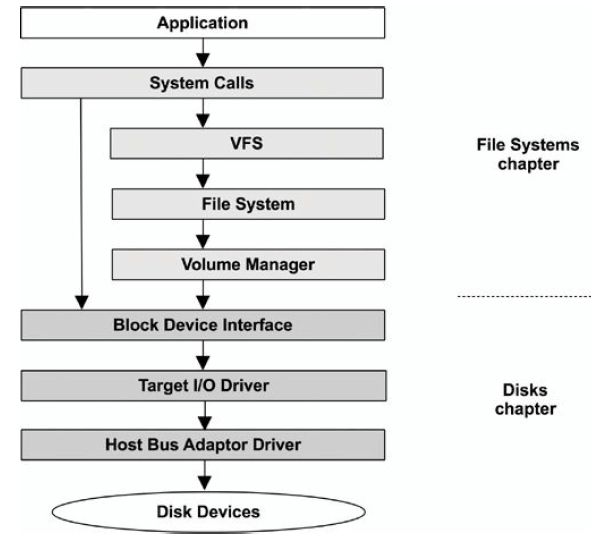
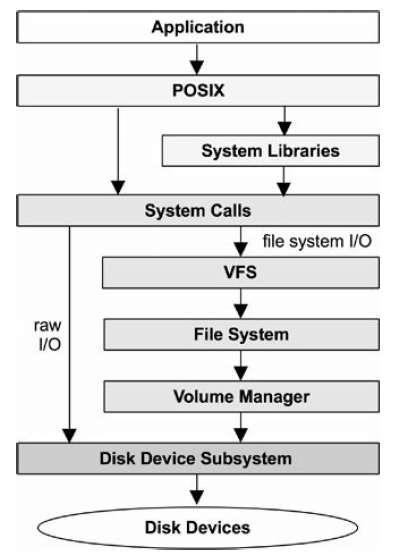
3.2.10 文件系统
VFS (Virtual File System)是一套内核接口,在不同文件系统之上做了抽象;起源于 Sun Microsystem,最初目的是让 UNIX File System (UFS) 和 NFS 更容易共存。
上面的图中可以看出,VFS 统一了:
- 磁盘文件系统
- 网络文件系统
- 内存文件系统
下图是 storage-device-based file system 的调用路径:
4. 观测工具(Observability Tools)
4.1.1 计数(counters)
系统级别工具:
vmstat: 操作系统级别的虚拟和物理内存统计信息mpstat: per-CPU 使用情况统计(mp: multi-processor?)iostat: per-disk I/O 统计, reported from the block device interfacenetstat: 网卡统计,TCP/IP 协议栈统计,某些 per-connection statisticssar: 各种杂七杂八的统计;can also archive them for historical reporting
这些工具有一个使用惯例:可以指定时间间隔(interval)和次数(count),例如
$ mpstat 1 3

11:19:50 AM  CPU    %usr   %nice    %sys %iowait    %irq   %soft  %steal  %guest %gnice   %idle
11:19:51 AM  all    0.00    0.00    1.00    0.00    0.00    0.00    0.00    0.00 0.00   99.00
11:19:52 AM  all    0.00    0.00    0.00    0.00    0.00    0.00    0.00    0.00 0.00  100.00
11:19:53 AM  all    0.00    0.00    0.00    0.00    0.00    0.26    0.00    0.00 0.00   99.74
Average:     all    0.00    0.00    0.34    0.00    0.00    0.08    0.00    0.00 0.00   99.58
进程级别工具:
pstoppmap: 进程内存段(memory segments)信息及使用统计等等
一般来说,这几个工具都是从 /proc/ 下面读数据的。
4.1.2 跟踪(tracing)
系统级别:
tcpdump: 抓包blktrace: block I/O tracing (Linux)DTrace: tracing of kernel internals and the usage of any resource (not just network or block I/O), using static and dynamic tracingSystemTap: tracing of kernel internals and the usage of any resource, using static and dynamic tracingperf: Linux Performance Events, tracing static and dynamic probes
进程级别:
strace: system call tracing for Linux-based systemsgdb: a source-level debugger, commonly used on Linux-based systems
4.1.3 Profiling
系统及进程级别:
oprofile: Linux system profilingperf: a Linux performance toolkit, which includes profiling subcommandsDTrace: programmatic profiling, timer-based using its profile provider, and hardwareevent- based using its cpc providerSystemTap: programmatic profiling, timer-based using its timer tapset, and hardware-eventbased using its perf tapsetcachegrind: from the valgrind toolkit, can profile hardware cache usage and be visualized using kcachegrind
4.1.4 监视(sar)
sar: System Activity Reporter(系统活动汇报器), 源自 AT&T UNIX。
sar(1) 是一个多功能计数器,利用定期 cron 来记录系统计数器的状态:
$ sar 1 3
Linux 5.4.0-26-generic (ubuntu)         04/28/2020      _x86_64_        (4 CPU)

11:36:25 AM     CPU     %user     %nice   %system   %iowait    %steal     %idle
11:36:26 AM     all      0.00      0.00      0.25      0.00      0.00     99.75
11:36:27 AM     all      0.00      0.00      0.25      0.00      0.00     99.75
11:36:28 AM     all      0.00      0.00      0.25      0.00      0.00     99.75
Average:        all      0.00      0.00      0.25      0.00      0.00     99.75
其他工具:atop (advanced top) 是一个更高级的系统和进程(system & proces)监视器。
4.2 观测源(Observability Sources)
表 4-1. Observability Sources
| Type | Source/Tool |
|---|---|
| per-process 计数器 | /proc |
| system-wide 计数器 | /proc, /sys |
| device driver & debug info | /sys |
| per-process tracing | ptrace, uprobes |
| CPU 性能计数器 | perf_event |
| Network tracing | libpcap |
| per-thread 延迟 | delay accounting |
| system-wide tracing | tracepoints, kprobes, ftrace |
4.2.1 /proc
/proc 是内存文件系统,不依赖磁盘:
- 目录树结构
- 通过文件系统相关的系统调用(
open/read/close),将内核统计信息暴露给用户空间 - 大部分数据都是只读的
top 会收集所有活跃进程(active processes)的 /proc 信息,
因此开销比较大,
这就是为什么有时执行 top 命令,会看到排在第一位进程的就是它自己。
/proc 中每个进程的信息:
$ ls -F /proc/4314/
arch_status      cpuset   loginuid    numa_maps      sched         status
attr/            cwd@     map_files/  oom_adj        schedstat     syscall
autogroup        environ  maps        oom_score      sessionid     task/
auxv             exe@     mem         oom_score_adj  setgroups     timers
cgroup           fd/      mountinfo   pagemap        smaps         timerslack_ns
clear_refs       fdinfo/  mounts      patch_state    smaps_rollup  uid_map
cmdline          gid_map  mountstats  personality    stack         wchan
comm             io       net/        projid_map     stat
coredump_filter  limits   ns/         root@          statm
limits: 已生效的资源限制(in-effect resource limits)maps: 已映射的内存区域sched: CPU 调度器相关的信息schedstat: CPU runtime, latency, and time slicessmaps: mapped memory regions with usage statisticsstat: 进程状态和统计,包括 CPU 和内存使用量statm: 内存使用量,以 page 为单位status: stat and statm information, 人类可读格式task: directory of per-task statistics
Linux 对 /proc 进行了扩展,将一些操作系统级别的统计放到了顶层:
$ cd /proc; ls -Fd [a-z]*
acpi/      dma          kcore        misc          scsi/          tty/
asound/    driver/      keys         modules       self@          uptime
buddyinfo  execdomains  key-users    mounts@       slabinfo       version
bus/       fb           kmsg         mpt/          softirqs       version_signature
cgroups    filesystems  kpagecgroup  mtrr          stat           vmallocinfo
cmdline    fs/          kpagecount   net@          swaps          vmstat
consoles   interrupts   kpageflags   pagetypeinfo  sys/           zoneinfo
cpuinfo    iomem        loadavg      partitions    sysrq-trigger
crypto     ioports      locks        pressure/     sysvipc/
devices    irq/         mdstat       sched_debug   thread-self@
diskstats  kallsyms     meminfo      schedstat     timer_list
cpuinfo: CPU 信息diskstats: disk I/O statistics for all disk devicesinterrupts: 硬中断信息loadavg: load averagesmeminfo: system memory usage breakdownsnet/dev: network interface statisticsnet/tcp: 当前活跃的 TCP socket 信息schedstat: system-wide CPU scheduler statisticsself: 指向当前进程的链接,方便使用slabinfo: 内核 slab allocator 缓存统计信息stat: 内核和系统资源状态汇总:CPUs, disks, paging, swap, processeszoneinfo: memory zone information
更多信息见 proc(5) man page 和内核文档:Documentation/filesystems/proc.txt。
4.2.2. /sys
Linux 提供的 sysfs 文件系统,挂载在 /sys,提供内核统计信息。
与 /proc 的不同:
/proc源自 Unix,有非常长的演进历史,已经在顶层(/proc/xxx)添加了各种系统统计指标/sys最初设计用于提供设备驱动信息,但后来进行了扩展,添加了很多其他类型的统计
例如,下面是 CPU 0 相关的 /sys 文件:
$ find /sys/devices/system/cpu/cpu0 -type f
/sys/devices/system/cpu/cpu0/crash_notes
/sys/devices/system/cpu/cpu0/cache/index0/type
/sys/devices/system/cpu/cpu0/cache/index0/level
/sys/devices/system/cpu/cpu0/cache/index0/physical_line_partition
/sys/devices/system/cpu/cpu0/cache/index0/number_of_sets
/sys/devices/system/cpu/cpu0/cache/index0/size
/sys/devices/system/cpu/cpu0/cache/index0/shared_cpu_map
[...]
其中和 CPU 的硬件缓存相关的文件:
$ grep . /sys/devices/system/cpu/cpu0/cache/index*/level
/sys/devices/system/cpu/cpu0/cache/index0/level:1
/sys/devices/system/cpu/cpu0/cache/index1/level:1
/sys/devices/system/cpu/cpu0/cache/index2/level:2
/sys/devices/system/cpu/cpu0/cache/index3/level:3

$ grep . /sys/devices/system/cpu/cpu0/cache/index*/size
/sys/devices/system/cpu/cpu0/cache/index0/size:32K
/sys/devices/system/cpu/cpu0/cache/index1/size:32K
/sys/devices/system/cpu/cpu0/cache/index2/size:256K
/sys/devices/system/cpu/cpu0/cache/index3/size:8192K
可以看到该 CPU 有:
- 2 个 L1 cache,各
32 KB - 1 个 L2 cache,
256 KB - 1 个 L3 cache,
8 MB
4.2.4. Delay Accounting
开启 CONFIG_TASK_DELAY_ACCT 后,Linux 会记录下列状态的延迟信息:
- 调度器延迟(Scheduler latency): waiting for a turn on-CPU
- Block I/O: waiting for a block I/O to complete
- 内存换出(Swapping): waiting for paging (memory pressure)
- 内存回收(Memory reclaim): waiting for the memory reclaim routine
技术上来时,调度器延迟的计算用的是 /proc 下面的 /schedstat 数据。
内核 Documentation/accounting 目录中有相关文档,delay-accounting.txt, and an
example consumer, getdelays.c:
$ ./getdelays -dp <pid>
4.2.6. 其他观测源
- CPU performance counters: 提供底层性能信息的可编程硬件寄存器(可以用
perf) - Per-process tracing:
strace,ptrace - Kernel tracing:
perf - Network sniffing:
tcpdump - Process accounting:
atop - System calls
4.3 DTrace
4.4 SystemTap
SystemTap 与 DTrace 功能类似,是在 DTrace 移植到 Linux 之前开发的。
探测点称为 probes。
SystemTap 利用了其他内核基础设施:
- 静态探测:
tracepoints - 动态探测:
kprobes - 用户态探测:
uprobes
These sources are also used by other tools (perf, LTTng).
4.5. perf
Linux Performance Events (LPE)。
5. Applications
5.4.3 系统调用分析
$ strace -ttt -T -p 1884
1356982510.395542 close(3) = 0 <0.000267>
1356982510.396064 close(4) = 0 <0.000293>
1356982510.396617 ioctl(255, TIOCGPGRP, [1975]) = 0 <0.000019>
参数:
-ttt: 打印时间戳,us精度-T: 打印系统调用耗时(最后一列),单位秒-p PID: 进程 ID
-c 打印 summary:
$ strace -c -p 1884
^CProcess 1884 detached
% time seconds  usecs/call calls errors syscall
------ -------- ---------- ----- ------ -------
83.29  0.007994 9          911   455    wait4
14.41  0.001383 3          455          clone
0.85   0.000082 0          2275         ioctl
0.68   0.000065 0          910          close
0.63   0.000060 0          4551         rt_sigprocmask
0.15   0.000014 0          455          setpgid
0.00   0.000000 0          455          rt_sigreturn
0.00   0.000000 0          455          pipe
------ -------- ---------- ----- ------ -------
100.00 0.009598            10467 455    total
time: 耗时百分比分布seconds: 总 system CPU time,单位秒usecs/call: 系统调用平均 system CPU time,单位uscalls: 系统调用次数syscall: 系统调用名
strace 是有开销的,看下面的例子:执行 500 万次 1 KB 的文件传输:
$ dd if=/dev/zero of=/dev/null bs=1k count=5000k
5120000+0 records in
5120000+0 records out
5242880000 bytes (5.2 GB) copied, 1.91247 s, 2.7 GB/s
加上 strace 之后,
$ strace -c dd if=/dev/zero of=/dev/null bs=1k count=5000k
5120000+0 records in
5120000+0 records out
5242880000 bytes (5.2 GB) copied, 140.722 s, 37.3 MB/s

% time seconds usecs/call calls errors syscall
------ ----------- ----------- --------- ------
51.46  0.008030 0         5120005 read
48.54  0.007574 0         5120003 write
...
0.00   0.000000 0         1       set_robust_list
------ ----------- ----------- --------- -----
100.00 0.015604 10240092 19 total
耗时从 1.9s 变成了 140s,慢了 73 倍。
6. CPU
- CPI: cycles per instruction
- IPC: instructions per cycle
6.4.1 Hardware
Microcode ROM:快速将指令转换成电路信号(converts instructions to circuit signals)
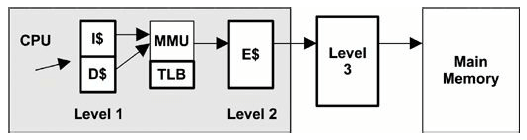
图 6-6. CPU cache hierarchy
- Level 1 instruction cache (I$)
- Level 1 data cache (D$)
- Translation lookaside buffer (TLB)
- Level 2 cache (E$)
- Level 3 cache (optional)
6.4.2 Software
Linux 的调度算法:
RT:实时调度(real-time workloads)- 优先级范围:
0–99(MAX_RT_PRIO–1) - 复杂度:
O(n)
- 优先级范围:
O(1):Linux 2.6 默认调度器- 复杂度:
O(1)
- 复杂度:
CFS:完全公平调度器(completely fair scheduling),2.6.23默认- 用红黑树替换原来的 run queue
- 查找更快
- Linux CFS 调度器:原理、设计与内核实现(2023)
用户进程能够通过调用 sched_setscheduler() 来设置调度器策略(scheduler policy)。
- RT 支持:
SCHED_RR和SCHED_FIFO策略 - CFS 支持:
SCHED_NORMAL和SCHED_BATCH策略
调度策略:
RR: SCHED_RR is round-robin schedulingFIFO: SCHED_FIFO is first-in first-out schedulingNORMAL: SCHED_NORMAL (previously known as SCHED_OTHER) is time-sharing scheduling and is the default for user processes. The scheduler dynamically adjusts priority based on the scheduling class. For O(1), the time slice duration is set based on the static priority: longer durations for higher-priority work. For CFS, the time slice is dynamic.BATCH: SCHED_BATCH is similar to SCHED_NORMAL, but with the expectation that the thread will be CPU-bound and should not be scheduled to interrupt other I/O-bound interactive work.
6.5.1. Tools Method
查看 CPU 相关信息的工具:
uptime:启动时间、loadavgvmstat:查看idle列,小于10%可能就有问题mpstat:查看哪个 CPU 比较繁忙,identifying a possible thread scalability problem.top:哪个进程消耗了最多的 CPU 资源pidstat:将 CPU 消耗分解到用户时间和系统时间perf/dtrace/stap/oprofile:Profiling CPUperf/cpustat:测量 CPI
6.5.5. Cycle Analysis
利用 CPU performance counters (CPCs) 可以在 cycle 级别理解 CPU 利用率。例如,可 以看到时间是花在:
- Level 1, 2, or 3 cache misses
- memory I/O
- resource I/O
- floating-point operations or other activity
6.5.8. 调整进程优先级
nice() 系统调用。
- nice 值越大,优先级越低
- root 用户可以设置负值,表示高优先级
6.6. Analysis
6.6.1. uptime
uptime 除了打印启动时间,还打印 load average:
$ uptime
9:04pm up 268 day(s), 10:16, 2 users, load average: 7.76, 8.32, 8.60
最后三个数字分别是过去 1、5 和 15 分钟的 load average:
- 如果 load average 大于 CPU 数量,说明负载过高,某些线性处于 waiting 状态
举个例子:一个现代 64 核 CPU,其 load average 为 128。这表示平均来说,每个 CPU 上:
- 总有一个线程在执行
- 另有一个线程在等待 CPU 资源
Linux load average 的计算:
- 包括了磁盘 I/O 信息(处于不可中断状态的磁盘 I/O 任务的数量)
- load average 不再与 CPU 数量划等号
6.6.2. vmstat
$ vmstat 1
procs -----------memory---------- ---swap-- -----io---- -system-- ------cpu-----
 r  b   swpd   free   buff  cache   si   so    bi    bo   in   cs us sy id wa st
 1  0      0 12922340   6196 93628288    0    0     0     0 11715 22285  3  3 94  0  0
 3  0      0 12906672   6196 93628400    0    0     0   568 13844 27175  4  3 93  0  0
 2  0      0 12921580   6196 93628592    0    0     0  2136 15105 28475  4  3 92  0  0
 8  0      0 12886696   6196 93628976    0    0     0  1108 19115 37964  6  4 90  0  0
r: run-queue length(可运行的线程总数)us: user-timesy: system-time (kernel)id: idlewa: wait I/O, which measures CPU idle when threads are blocked on disk I/Ost: stolen (not shown in the output), which for virtualized environments shows CPU time spent servicing other tenants
r 表示的是所有 CPU 上可运行线程的总数,除了 r 之外,上面其他所有列都是所有
CPU 的一个平均值。
6.6.3. mpstat
多处理器统计工具(multiprocessor statistics tool),打印 per CPU 统计信息。
$ mpstat -P ALL 1

09:05:10 AM  CPU    %usr   %nice    %sys %iowait    %irq   %soft  %steal  %guest  %gnice   %idle
09:05:11 AM  all    0.00    0.00    0.25    0.00    0.00    0.25    0.00    0.00    0.00   99.49
09:05:11 AM    0    0.00    0.00    0.00    0.00    0.00    0.00    0.00    0.00    0.00  100.00
09:05:11 AM    1    0.00    0.00    0.00    0.00    0.00    1.00    0.00    0.00    0.00   99.00
09:05:11 AM    2    0.00    0.00    0.00    0.00    0.00    0.00    0.00    0.00    0.00  100.00
09:05:11 AM    3    0.00    0.00    1.03    0.00    0.00    0.00    0.00    0.00    0.00   98.97
...
-P ALL 选项打印每个 CPU 的统计。每列数据:
CPU: logical CPU ID, or all for summary%usr: user-time%nice: user-time for processes with a nice’d priority%sys: system-time (kernel)%iowait: I/O wait%irq: 硬件中断%soft: 软件中断%steal: time spent servicing other tenants%guest: CPU time spent in guest virtual machines%idle: idle
排查网络丢包时,有时会关注其中的硬中断和软中断列。
6.6.4. sar
System Activity Reporter, sar(1).
-P ALL:所有 CPU-u:打印 system-wide average only-q:includes run-queue size as runq-sz (waiting和running状态的线程数量,和vmstat的r列一样) and load averages
6.6.5. ps
Process Status command, ps(1).
BSD 风格参数不带 -:
a:list all usersu:with extended user-oriented detailsx:include processes without a terminal
$ ps aux
USER         PID %CPU %MEM    VSZ   RSS TTY      STAT START   TIME COMMAND
root           1  0.0  0.2 168932 13124 ?        Ss   Apr26   0:20 /sbin/init auto noprompt
root           2  0.0  0.0      0     0 ?        S    Apr26   0:00 [kthreadd]
root           3  0.0  0.0      0     0 ?        I<   Apr26   0:00 [rcu_gp]
root           4  0.0  0.0      0     0 ?        I<   Apr26   0:00 [rcu_par_gp]
root           6  0.0  0.0      0     0 ?        I<   Apr26   0:00 [kworker/0:0H-kblockd]
UNIX 风格:
-e:list every process-f:full details
$ ps -ef
UID          PID    PPID  C STIME TTY          TIME CMD
root           1       0  0 Apr26 ?        00:00:20 /sbin/init auto noprompt
root           2       0  0 Apr26 ?        00:00:00 [kthreadd]
root           3       2  0 Apr26 ?        00:00:00 [rcu_gp]
root           4       2  0 Apr26 ?        00:00:00 [rcu_par_gp]
root           6       2  0 Apr26 ?        00:00:00 [kworker/0:0H-kblockd]
TIME 和 %CPU 两列和 CPU 相关:
TIME:进程自启动以来消耗的所有 CPU 时间(user + system),格式hours:minutes:seconds。%CPU:进程在过去一秒内消耗的所有 CPU(usage)。 单线程、CPU 密集型进程,这一列会显示100%;两个线程、CPU 密集型会显示200%。
6.6.6. top
top 是最常用的查看系统性能的工具,但要注意,top 本身也可能会消耗大量资源,因
为它要遍历 /proc 下面的文件,通过 open/read/close 等系统调用来获取它需要的数
据。
由于 top 是对 /proc 进行快照(snapshot),因此它无法捕捉到生命周期非常短的进程(shot-lived processes),
例如 CI/CD 里面的某些 job。atop 是 top 的增强版,利用了进程审计(process accounting),能捕捉生命周期非常短的进程。
6.6.8. pidstat
pidstat(1) 打印进程或线程的 CPU 使用率,默认只显示活跃进程:
$ pidstat 1
09:19:11 AM   UID       PID    %usr %system  %guest    %CPU   CPU  Command
09:19:12 AM     0      1525    4.00    0.00    0.00    4.00    28  dockerd
09:19:12 AM     0      1557    0.00    1.00    0.00    1.00    28  containerd
09:19:12 AM     0     16262    1.00    0.00    0.00    1.00    30  tmux
09:19:12 AM     0     82525    0.00    3.00    0.00    3.00    29  rsyslogd
09:19:12 AM     0     94684    0.00    1.00    0.00    1.00    30  kworker/30:1-events_power_efficient
...
-p ALL选项打印所有进程,包括活跃和空闲进程-t打印 per thread 统计信息
6.6.9. time
time(1) 可用于测量程序的执行时间和 CPU 使用量。这个命令可能是操作系统提供的,
也可能是 shell 内置的(built-in)。
$ time cksum Fedora-16-x86_64-Live-Desktop.iso
560560652 633339904 Fedora-16-x86_64-Live-Desktop.iso

real 0m5.105s
user 0m2.810s
sys  0m0.300s

$ time cksum Fedora-16-x86_64-Live-Desktop.iso
560560652 633339904 Fedora-16-x86_64-Live-Desktop.iso

real 0m2.474s
user 0m2.340s
sys  0m0.130s
上面同一条命令执行了两次。
第一次执行花了 5.1s
usr部分:计算 checksumsys部分:读取文件的系统调用(read)耗时- 剩余
5.1-2.8-0.3 = 2.0s:可能是花在磁盘 I/O
第二次执行快了很多,因为文件被缓存了,介绍了磁盘 I/O 开销。
6.6.12. perf
表 6-8. perf 子命令
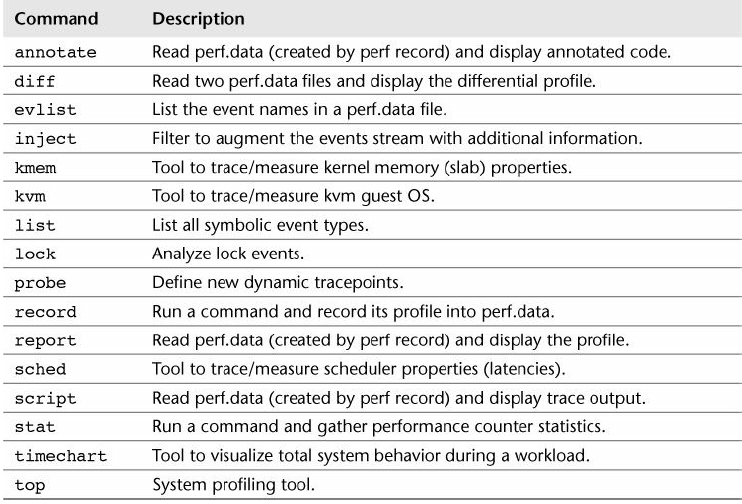
System Profiling
Profiling 录制,会在当前目录生成一个 perf.data 文件:
-a:all CPUs-g:with call stacks-F 997:sample at 997 Hzsleep 10:sample for10s
$ perf record -a -g -F 997 sleep 10
[ perf record: Woken up 44 times to write data ]
[ perf record: Captured and wrote 13.251 MB perf.data (~578952 samples) ]
分析(读取 perf.data 文件):
--stdio:直接打印,而不是交互式模式
$ perf report --stdio
[...]
    72.98% swapper [kernel.kallsyms] [k] native_safe_halt
           |
           --- native_safe_halt
               default_idle
               cpu_idle
    9.43% dd [kernel.kallsyms] [k] acpi_pm_read
           |
           --- acpi_pm_read
               ktime_get_ts
               |
               |--87.75%-- __delayacct_blkio_start
               |           io_schedule_timeout
               |           balance_dirty_pages_ratelimited_nr
stat
perf stat 在 CPU 时钟周期维度打印进程的统计信息。
$ perf stat gzip test.log

 Performance counter stats for 'gzip test.log':

          1.411368      task-clock (msec)         #    0.782 CPUs utilized
                 0      context-switches          #    0.000 K/sec
                 0      cpu-migrations            #    0.000 K/sec
               104      page-faults               #    0.074 M/sec
         3,227,785      cycles                    #    2.287 GHz
         1,818,096      stalled-cycles-frontend   #   56.33% frontend cycles idle
         3,543,315      instructions              #    1.10  insn per cycle
                                                  #    0.51  stalled cycles per insn
           606,245      branches                  #  429.544 M/sec
            24,343      branch-misses             #    4.02% of all branches

       0.001803835 seconds time elapsed
-e 指定具体的事件(events):
$ perf list # list all events

$ perf stat -e instructions,cycles,L1-dcache-load-misses,LLC-load-misses gzip test.log

 Performance counter stats for 'gzip test.log':

         1,126,600      instructions              #    0.65  insn per cycle
         1,725,828      cycles
            20,414      L1-dcache-load-misses
             2,144      LLC-load-misses

       0.001142968 seconds time elapsed
注意其中的 0.65 insn per cycle,表示每个时钟周期执行 0.65 条命令(IPC).
Software Tracing
perf record -e 可用来追踪内核调度器的活动。perf list 列出了可追踪点,其中包括
- software events
- tracepoint events (static probes)
$ perf list
context-switches OR cs [Software event]
cpu-migrations OR migrations [Software event]
...
下面的例子跟踪应用程序离开 CPU(上下文切换)的事件(-e context-switches),并记录其调用栈信息(-g):
$ perf record -g -a -e context-switches sleep 10
[ perf record: Woken up 1 times to write data ]
[ perf record: Captured and wrote 1.387 MB perf.data (6239 samples) ]
$ perf report --stdio
#
# Children      Self  Command          Shared Object            Symbol
# ........  ........  ...............  .......................  ........................
#
    48.40%    48.40%  swapper          [kernel.kallsyms]        [k] schedule_idle
            |
            ---secondary_startup_64
               |
                --48.24%--start_secondary
                          cpu_startup_entry
                          do_idle
                          schedule_idle
                          schedule_idle

    48.40%     0.00%  swapper          [kernel.kallsyms]        [k] secondary_startup_64
            |
            ---secondary_startup_64
               |
                --48.24%--start_secondary
                          cpu_startup_entry
                          do_idle
                          schedule_idle
                          schedule_idle
6.6.14. Other Tools
其他 Linux CPU 性能工具:
oprofile: the original CPU profiling tool by John Levon.htopatop/proc/cpuinfogetdelays.c: This is an example of delay accounting observability and includes CPU scheduler latency per process.valgrind: a memory debugging and profiling toolkit [6]. It contains callgrind, a tool to trace function calls and gather a call graph, which can be visualized using kcachegrind; and cachegrind for analysis of hardware cache usage by a given program.
6.7
6.7.1 Ad Hoc
下面的命令创建一个单线程、CPU 100% 任务:
while :; do :; done &
6.7.2 SysBench
SysBench 自带了一个简单的 CPU benchmark 工具,计算质数:
$ sysbench --threads=8 --test=cpu --cpu-max-prime=100000 run

Running the test with following options:
Number of threads: 2
Initializing random number generator from current time

Prime numbers limit: 10000
Initializing worker threads...
Threads started!

CPU speed:
    events per second:  1434.64

General statistics:
    total time:                          10.0067s
    total number of events:              14359

Latency (ms):
         min:                                    1.11
         avg:                                    1.39
         max:                                   65.17
         95th percentile:                        1.52
         sum:                                19970.36

Threads fairness:
    events (avg/stddev):           7179.5000/437.50
    execution time (avg/stddev):   9.9852/0.00
6.8.2. 调度优先级和类别(class)
设置 nice 值(越大优先级越低):
$ nice -n 19 command
6.8.4. 绑定 CPU
增加缓存和内存命中率:
$ taskset -pc 7-10 10790
pid 10790's current affinity list: 0-15
pid 10790's new affinity list: 7-10
6.8.5. 独占 CPU(Exclusive CPU Sets)
绑定 CPU 只是保证进程只会在某些 CPU 上执行,但这些 CPU 并不是被该进程独占的。
独占 CPU 需要 cpuset。下面的命令创建一个 exclusive cpu set:
$ mkdir /dev/cpuset
$ mount -t cpuset cpuset /dev/cpuset

$ cd /dev/cpuset
$ mkdir prodset          # 创建一个名为 "prodset" 的 cpuset

$ cd prodset
$ echo 7-10 > cpus       # 分配 CPUs 7-10
$ echo 1 > cpu_exclusive # 设置独占标记(exclusive)
$ echo 1159 > tasks      # 绑定进程号(PID)
7. Memory
7.2.1. Virtual Memory
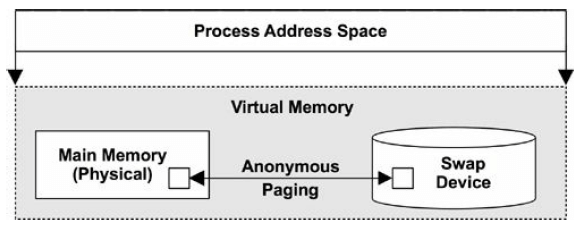
图 7-1. 进程虚拟内存
7.2.3. Demand Paging
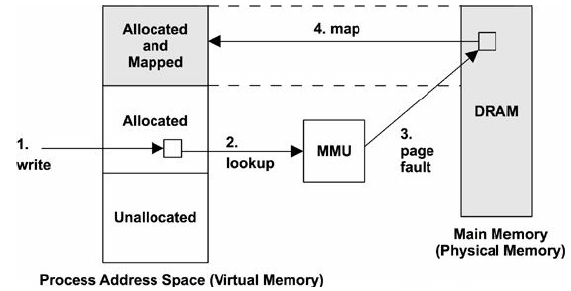
图 7-2. 缺页(page fault)示例
虚拟内存中,页面(page)可能处于以下某种状态:
- A. 未分配(Unallocated)
- B. 已分配,但未映射(Allocated, but unmapped (unpopulated and not yet faulted))
- C. 已分配,且已映射到内存(Allocated, and mapped to main memory (RAM))
- D. 已分配,且已映射到 swap 设备(Allocated, and mapped to the physical swap device (disk))
根据以上状态,定义两个术语:
- Resident set size (RSS,常驻内存):
C状态的内存大小 - Virtual memory size:所有已分配区域之和(
B+C+D)
7.2.5. Swapping(换出)
Swapping:将整个进程在主存(main memory)和物理 swap 设备或 swap 文件之间移动。
This is the original Unix technique for managing main memory and is the origin of the term swap [Thompson 78].
要换出一个进程,必须将其私有数据写到 swap 设备,这包括 thread structures 和 进程堆(匿名数据)。从文件系统中读来的且未被修改过的数据,可以丢弃,下次需要时再 重新从文件系统读取。
进程被换出后,内核仍然能感知到它们,因为进程的某些元数据是常驻内核内存(kernel memory)的。在进程换入时,内核会考虑:
- 线程优先级
- 等待磁盘时间(the time it was waiting on disk)
- 进程大小(the size of the process)
等待时间较长、体积比较小的进程会被优先换入。
Swapping 会严重影响性能,因为被换出的进程在重新换入时需要大量磁盘 I/O。 对于早期 Unix 机器,例如 PDP-11(maximum process size 64 KB),swapping 是比较有用的。
7.2.6. 用于文件系统缓存的内存
操作系统启动后内存使用量一直在增长是正常的,因为它会对文件系统进行缓存,提高读写 性能。
当应用程序需要大量内存时,内核会自动释放用于文件系统缓存的内存。
7.2.8. 内存分配器
虚拟内存子系统负责物理内存的多任务执行(multitasking of physical memory)。
在虚拟内存空间内,具体的内存分配和放置(allocation and placement)则是由分配器( allocator)来完成的。这些分配器的实现方式包括:
- 用户态函数库(user-land libraries)
- 内核函数(kernel-based routines)
分配器向程序员提供非常简单的编程接口(例如 malloc(), free()),不同的分配器
性能差异可能很大。
7.3 Architecture
7.3.1 Hardware
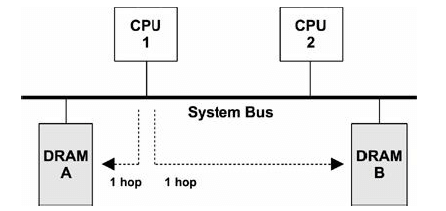
图 7-3. 对称内存访问(UMA)示例
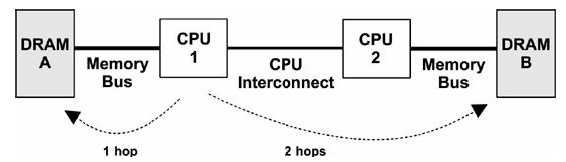
图 7-4. 非对称内存访问(NUMA)示例
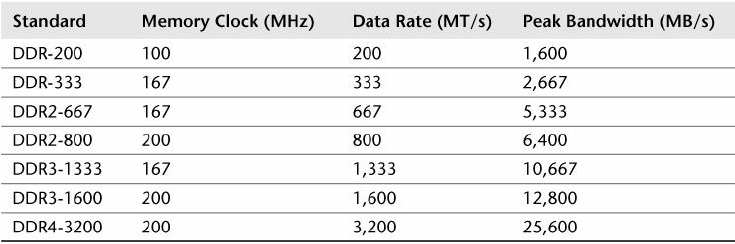
DDR SDRAM(1996)
Double Data Rate Synchronous Dynamic Random-Access Memory (DDR SDRAM).
- double data rate:在时钟信号的上升和下降沿都会进行数据传输(the transfer of data on both the rise and fall of the clock signal)。
- synchronous:内存和 CPU 是同步操作(the memory being clocked synchronously with the CPUs)
表 7-1. DDR 带宽
CPU Cache
- Level 1: usually split into a separate instruction cache and data cache
- Level 2: a cache for both instructions and data
- Level 3: another larger level of cache
MMU
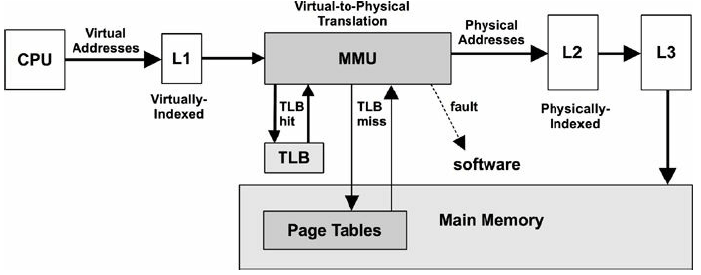
图 7-5. 内存管理单元(MMU)
7.3.2. Software
释放内存
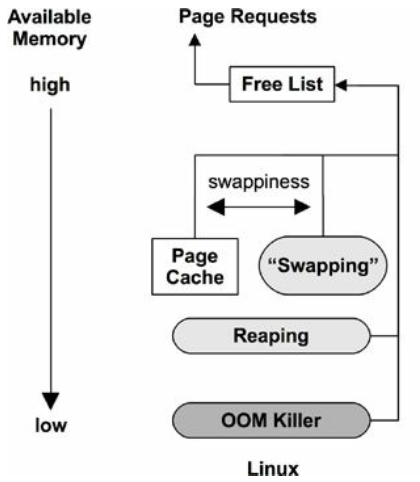
图 7-6. 释放内存
方式:
- 空闲链表(Free list): 一般每个 NUMA 节点一个链表。
- Reaping(收割):也称为 shrinking,当可用内存降低到某个阈值时,内核模块和内核 slab 分配器立即释放某些低优先级内存。
在 Linux 上,具体方式为:
- 页面缓存(Page cache): 这是文件系统缓存。配置参数
swappiness,在某个阈 值倾向于释放页面缓存,而不是 swap 出去。 - Swapping:由 page-out daemon
kswapd完成。 - OOM killer:寻找可被牺牲的进程(
select_bad_process()), 然后干掉它(oom_kill_process())。 可能会在系统日志(/var/log/messages)中打印"Out of memory: Kill process"。
swappiness 范围 0-100,默认值 60:
- 值越大,越倾向于 swap 方式
- 值越小,越倾向于直接释放页面缓存方式
7.3.3. Process Address Space
Linux allocators:
- kernel-level: slab and SLUB
- user-level: glibc
slab: Linux 2.2 ~ 2.6 default
- 管理固定大小的对象缓存,这些对象可被循环利用(manages caches of objects of a specific size, allowing them to be recycled)
- 无需页面分配过程,因此很快(quickly without the overhead of page allocation)
- 适合内核内存分配,因为内核经常使用固定大小的结构体(fixed-size structs)
SLUB: Linux 2.6+ default
- 比 slab 性能更好(improved over slab)
glibc,为取得高性能,针对不同大小采用不同分配算法/策略:
- 小对象:buddy algorithm
- 大对象:tree lookup
- 超级大对象:
mmap()
7.4.1 Tools Method
检查下列方面:
- 页面扫描(Page scanning):持续的 page scanning (超过
10s) 是内存压力的征兆sar -B查看pgscan列
- Paging: The paging of memory 是内存不足的进一步征兆。
vmstat查看si和so列(here, the term swapping means anonymous paging)
- 可用内存
vmstat 1:查看free列
- OOM killer
/var/log/messages或dmesg中搜索“Out of memory”
- 进程占用内存排序,包括物理内存(RSS)和虚拟内存
top:具体看哪一列可能略有差异,参考文档man top
- 跟踪内存分配情况,搞清内存使用量的根本原因
- dtrace/stap/perf
7.5 Analysis
表 7-4. 内存分析工具
| 工具 | 简介 |
|---|---|
vmstat |
物理和虚拟内存统计信息 |
sar |
历史统计信息 |
slabtop |
内核 slab 分配器统计信息 |
ps |
进程状态(Process Status) |
top |
监控每个进程的内存使用情况 |
pmap |
进程地址空间统计信息 |
DTrace |
动态跟踪内存分配(allocating tracing) |
7.5.1. vmstat
Virtual Memory STATistics:系统内存监控状态的高层概览,包括当前的可用内存和 paging 统计:
$ vmstat 1
procs -----------memory---------- ---swap-- -----io---- -system-- ------cpu-----
 r  b   swpd   free   buff  cache   si   so    bi    bo   in   cs us sy id wa st
 1  0      0 5323620  39064 347756    0    0     7     3   24   32  0  0 100  0  0
 0  0      0 5323620  39064 347868    0    0     0     0  122  132  0  0 100  0  0
 0  0      0 5323620  39064 347868    0    0     0     0   95  128  0  0 100  0  0
 0  0      0 5323620  39064 347868    0    0     0     0  104  132  0  0 100  0  0
swpd: amount of swapped-out memoryfree: free available memorybuff: memory in the buffer cachecache:页面缓存(memory in the page cache)si:换入的内存(memory swapped in (paging))so:换出的内存(memory swapped out (paging))
buffer 和 page caches 将在第 8 章“文件系统”介绍。
如果 si 和 so 列的值持续非零,说明系统目前有内存压力,在持续地有页面换入换出
。可以用其他工具来定位哪些进程在消耗内存。
参数:
-S:排序-m:以 MB 为单位显示
$ vmstat 1 -Sm
procs -----------memory---------- ---swap-- -----io---- -system-- ------cpu-----
 r  b   swpd   free   buff  cache   si   so    bi    bo   in   cs us sy id wa st
 0  0      0   5450     40    356    0    0     7     3   24   32  0  0 100  0  0
 0  0      0   5450     40    356    0    0     0     0   96  123  0  0 100  0  0
 0  0      0   5450     40    356    0    0     0     0   95  120  0  0 100  0  0
 0  0      0   5450     40    356    0    0     0     0   90  116  0  0 100  0  0
-a 将 page cache 的活跃和非活跃内存分开展示:
$ vmstat -a 1
procs -----------memory---------- ---swap-- -----io---- -system-- ------cpu-----
 r  b   swpd   free  inact active   si   so    bi    bo   in   cs us sy id wa st
 1  0      0 5321860 166760 399344    0    0     7     3   24   32  0  0 100  0  0
 0  0      0 5321948 166760 399504    0    0     0   892  141  143  0  0 100  0  0
 0  0      0 5321948 166760 399504    0    0     0     0   97  121  0  0 100  0  0
如果系统有持续的页面扫描(page scanning,sr)活动,说明内存有压力。可以通过其
他工具调查内存用在哪了。
7.5.2. sar
参数:
-B: paging statistics-H: huge pages statistics-r: memory utilization-R: memory statistics-S: swap space statistics-W: swapping statistics
不同参数的输出中,每列的含义及其单位:
+-----+-------------+-------------------------------------------------------------------------------+------------+
|     | pgpgin/s    | page-ins                                                                      | KB/s       |
|     | pgpgout/s   | page-outs                                                                     | KB/s       |
|     | fault/s     | both major and minor faults                                                   | count/s    |
|     | majflt/s    | major faults                                                                  | count/s    |
| -B  | pgfree/s    | pages added to free list                                                      | count/s    |
|     | pgscank/s   | pages scanned by background page-out daemon (kswapd)                          | count/s    |
|     | pgscand/s   | direct page scans                                                             | count/s    |
|     | pgsteal/s   | page and swap cache reclaims                                                  | count/s    |
|     | %vmeff      | ratio of page steal/page scan, which shows page reclaim efficiency            | percent    |
+-----+-------------+-------------------------------------------------------------------------------+------------|
|     | hbhugfree   | free huge pages memory (large page size)                                      | KB         |
| -H  | hbhugeused  | used huge pages memory                                                        | KB         |
+-----+-------------+-------------------------------------------------------------------------------+------------|
|     | kbmemfree   | free memory                                                                   | KB         |
|     | kbmemused   | used memory (excluding the kernel)                                            | KB         |
|     | kbbuffers   | buffer cache size                                                             | KB         |
|     | kbcached    | page cache size                                                               | KB         |
| -r  | kbcommit    | main memory committed: an estimate of the amount needed to serve the current  | KB         |
|     |             | workload                                                                      |            |
|     | %commit     | main memory committed for current workload, estimate                          | percent    |
|     | kbactive    | active list memory size                                                       | KB         |
|     | kbinact     | inactive list memory size                                                     | KB         |
+-----+-------------+-------------------------------------------------------------------------------+------------|
|     | frpg/s      | memory pages freed; negative indicates allocations                            | pages/s    |
| -R  | bufpg/s     | buffer cache page additions (growth)                                          | pages/s    |
|     | campg/s     | page cache page additions (growth)                                            | pages/s    |
+-----+-------------+-------------------------------------------------------------------------------+------------+
|     | kbswpfree   | free swap space                                                               | KB         |
| -S  | kbswpused   | used swap space                                                               | KB         |
|     | kbswpcad    | cached swap space: this resides in both main memory and the swap device and   | KB         |
|     |             | so can be paged out without disk I/O                                          |            |
+-----+-------------+-------------------------------------------------------------------------------+------------+
|     | pswpin/s    | page-ins (Linux "swap-ins")                                                   | pages/s    |
| -W  | pswpout/s   | page-outs (Linux "swap-outs")                                                 | pages/s    |
+-----+-------------+-------------------------------------------------------------------------------+------------+
要深入理解这些字段,可以查看内核源码(mm/),尤其是 mm/vmscan.c。
%vmeff 衡量的是页面回收效率(page reclaim efficiency):
- 值越大(高),表示回收速度越快,系统越健康;值越小(低)表示系统回收越慢,有问题
- man page 中说
100%算高,30%算低
7.5.3. slabtop
打印内核 slab 缓存使用信息:
-sc:按 cache size 排序
$ slabtop -sc
 Active / Total Objects (% used)    : 543810 / 560981 (96.9%)
 Active / Total Slabs (% used)      : 11562 / 11562 (100.0%)
 Active / Total Caches (% used)     : 102 / 143 (71.3%)
 Active / Total Size (% used)       : 143821.87K / 149482.23K (96.2%)
 Minimum / Average / Maximum Object : 0.01K / 0.27K / 8.00K

  OBJS ACTIVE  USE OBJ SIZE  SLABS OBJ/SLAB CACHE SIZE NAME
 36305  35544  97%    0.59K    685       53     21920K inode_cache
 13369  12010  89%    1.07K    461       29     14752K ext4_inode_cache
103080 100524  97%    0.13K   1718       60     13744K kernfs_node_cache
 71274  65417  91%    0.19K   1697       42     13576K dentry
 12096  10238  84%    0.57K    216       56      6912K radix_tree_node
  1656   1648  99%    4.00K    207        8      6624K kmalloc-4k
这些信息来自 /proc/slabinfo,vmstat -m 也会打印相同信息。
7.5.5. ps
$ ps aux
-o specify output columns:
$ ps -eo
    PID %MEM    VSZ   RSS COMMAND
      1  0.1 167660 11484 systemd
      2  0.0      0     0 kthreadd
      3  0.0      0     0 rcu_gp
      4  0.0      0     0 rcu_par_gp
      6  0.0      0     0 kworker/0:0H-kblockd
      8  0.0      0     0 mm_percpu_wq
      9  0.0      0     0 ksoftirqd/0
     10  0.0      0     0 rcu_sched
7.5.6. top
$ top
top - 16:52:43 up  4:25,  2 users,  load average: 0.00, 0.01, 0.00
Tasks: 242 total,   1 running, 241 sleeping,   0 stopped,   0 zombie
%Cpu(s):  0.0 us,  0.1 sy,  0.0 ni, 99.9 id,  0.0 wa,  0.0 hi,  0.0 si,  0.0 st
MiB Mem :   5994.5 total,   5170.5 free,    435.5 used,    388.6 buff/cache
MiB Swap:   2048.0 total,   2048.0 free,      0.0 used.   5315.7 avail Mem

    PID USER      PR  NI    VIRT    RES    SHR S  %CPU  %MEM     TIME+ COMMAND
   1250 arthurc+  20   0   21052   6332   3268 S   0.3   0.1   0:06.65 tmux: server
      1 root      20   0  167660  11484   8356 S   0.0   0.2   0:03.04 systemd
      2 root      20   0       0      0      0 S   0.0   0.0   0:00.02 kthreadd
      3 root       0 -20       0      0      0 I   0.0   0.0   0:00.00 rcu_gp
7.5.8. pmap
列出进程的内存映射(memory mappings of a process):
$ ps -xs $(pidof vim)
  UID     PID PENDING BLOCKED IGNORED    CAUGHT STAT TTY  TIME COMMAND
 1000    1041 0000000 8014a03 0001000 180000000 Ss   ?    0:00 /lib/systemd/systemd --user
 1000    1047 0000000 0000000 0001000 180000000 S    ?    0:00 (sd-pam)
 1000    1061 0000000 0000000 0001000 180004002 SNsl ?    0:00 /usr/libexec/tracker-miner-fs
 1000    1062 0000000 0000000 0380004 04b817efb S+   tty1 0:00 -bash
 1000    1077 0000000 0000000 0001000 180000a00 Ssl  ?    0:00 /usr/libexec/gvfsd
7.5.11. Other Tools
其他查看内存性能的工具:
free: 可用内存信息,with buffer cache and page cache (see Chapter 8, File Systems).dmesg: 搜索“Out of memory”valgrind: a performance analysis suite, including memcheck, a wrapper for user-level allocators for memory usage analysis including leak detection. This costs significant overhead; the manual advises that it can cause the target to run 20 to 30 times slower [3].swapon: to add and observe physical swap devices or files.iostat: If the swap device is a physical disk or slice, device I/O may be observable using iostat(1), which indicates that the system is paging.perf: investigate CPI, MMU/TSB events, and memory bus stall cycles from the CPU performance instrumentation counters. It also provides probes for page faults and several kernel memory (kmem) events./proc/zoneinfo:memory zone 统计(NUMA)/proc/buddyinfo
7.6.1. 参数调优
可调参数见:Documentation/sysctl/vm.txt,可通过 sysctl(8) 调节。
7.6.4. Resource Controls
ulimit:设置内存和虚拟内存使用大小。
cgroups 内存子系统提供了更多控制:
memory.memsw.limit_in_bytes:最大允许的内存和 swap 空间,单位 Bytememory.limit_in_bytes:最大允许的用户内存(user memory),包括文件缓存(file cache),单位 Bytememory.swappiness:和前面提到的vm.swappiness类似,但应用于 group 级别memory.oom_control:0 或 1,打开和关闭 OOM killer
8. File Systems
研究应用的 I/O 性能时,文件系统的性能比磁盘的性能更重要。
文件系统通过 caching, buffering, and asynchronous I/O 技术避免了直接将磁盘暴露给应用。
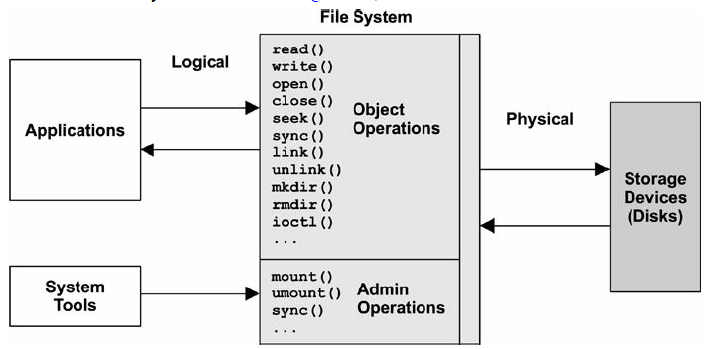
8.2.1. 文件系统接口
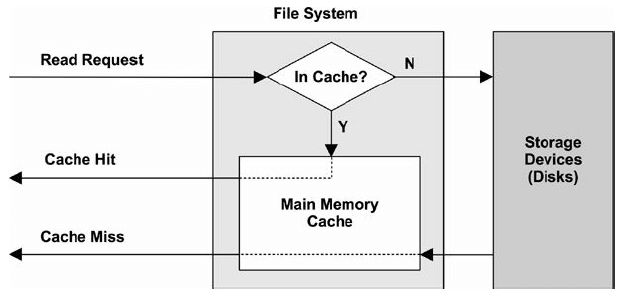
8.2.2. 文件系统缓存(File System Cache)
8.3. Concepts
8.3.2. Caching
机器启动后,文件系统会将部分内存用作缓存(cache),以提升读写性能,该过程对应用 (applications)是透明的。
- caching:提升读性能
- buffering (in the cache):提升写性能
表 8-1. 缓存类型
| Cache | Example |
|---|---|
| Page cache | 操作系统的页面缓存 |
| 文件系统的主缓存(primary cache) | ZFS ARC |
| 文件系统的次级缓存(secondary cache) | ZFS L2ARC |
| 目录缓存 | 目录缓存,DNLC |
| inode 缓存 | inode 缓存 |
| 设备缓存 | ZFS vdev |
| 块设备缓存 | buffer cache |
8.3.6. Write-Back Caching(写缓存)
异步写过程:
- 应用调用
write(),将执行过程交给内核 - 数据从应用的地址空间(用户空间)复制到内核
write系统调用完成,内核返回,将执行过程交回应用- 某个异步的内核任务将数据写到磁盘
文件系统也提供了同步写接口,等待写入磁盘后才返回。
8.3.8. Raw and Direct I/O
- 裸 I/O(Raw I/O)绕过(bypass)文件系统,直接写到设备上
- 直接 I/O(Direct I/O)仍然使用文件系统,但绕过(bypass)文件系统缓存
8.3.13. 文件系统操作耗时
Intel Xeon 2.4 GHz 多处理器:
表 8-2. 缓存类型
| 操作 | 平均耗时(us) |
|---|---|
open() |
2.2 |
close() |
0.7 |
read() 4KB (cached) |
3.3 |
read() 128KB (cached) |
13.9 |
write() 4KB (async) |
9.3 |
write() 128KB (async) |
55.2 |
可以看到,写比读慢 3 倍左右。
8.3.14. 特殊文件系统
用于特殊目的的文件系统,例如:
- 临时文件(
/tmp) - 内核设备文件(
/dev) - 系统统计(
/proc)
8.4.1. 文件系统 I/O 栈
8.4.3. 文件系统缓存
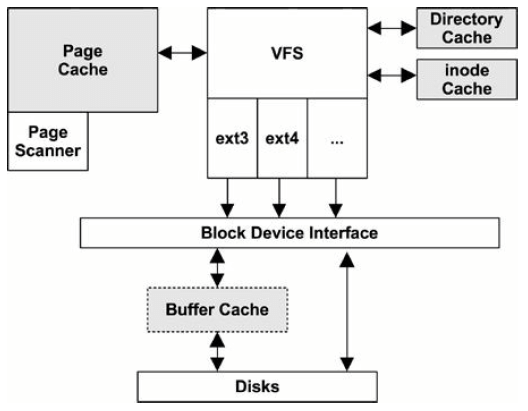
页面缓存(Page Cache)
页面缓存的大小是动态的,内存比较空闲的时候缓存会变大,内存紧张的时候会自动释
放一些缓存(见第 7 章的 swapiness 配置项)。
修改过的(dirty)页面会被异步地刷到磁盘。
触发异步刷的场景:
- 过了某个固定时间间隔(例如 30s)
sync(),fsync(), ormsync()系统调用- 脏页面过多(dirty_ratio)
- 页面缓存空间不足(No available pages in the page cache)
系统内存不足时,另一个内核线程 —— page-out daemon(kswapd,也叫 page scanner)
—— 也可能会调度脏页面写到磁盘的操作。
kswapd 和异步 flush 线程都是内核线性,在某些性能工具的输出中可以看到。
8.4.5. 文件系统类型
- Berkeley Fast File System (FFS)
- UFS: FFS was introduced in SunOS 1.0 in 1984 as UFS
- ext3/ext4
- ZFS: ZFS was developed by Sun Microsystems and released in 2005
btrfs: B-tree file system (btrfs) is based on copy-on-write B-trees, by Oracle, 2014
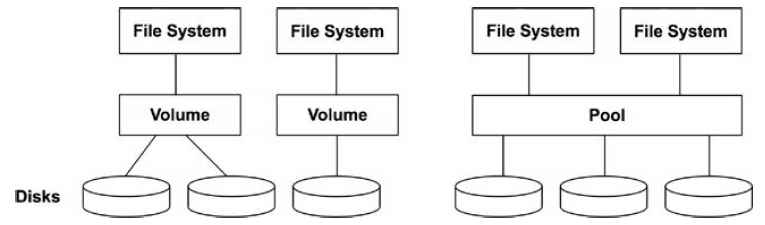
8.4.6. Volumes and Pools
最初的文件系统建立在单个磁盘(disk)或磁盘分区(disk partition)上。
Volumes 和 pools 使得文件系统能够建立在多个磁盘上,并且支持不同的 RAID 策略(见第 9 章)。
Volume 将多个磁盘抽象为一个虚拟磁盘
- 如果文件系统是建立在多个完整磁盘上(而不是 slice 或 partition),volume 能够 隔离 workload,减少竞争导致的性能下降
- 一个 volume 只支持一种文件系统
- LVM:Logical Volume Manager
Pool 方式将多个磁盘作为一个池子,
- 同一个 pool 支持多个文件系统
- 文件系统和磁盘解耦
- 现代文件系统多采用这种方式,例如 ZFS 和 btrfs
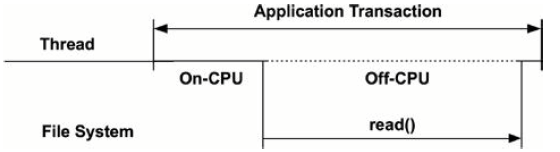
8.5.2. Latency Analysis
8.6. Analysis
表 8-6. 文件系统相关工具
| 工具 | 简介 |
|---|---|
strace |
debug 系统调用 |
DTrace |
动态跟踪文件系统操作和耗时 |
free |
缓存用量统计 |
top |
内存使用情况 |
vmstat |
虚拟内存情况 |
sar |
各种历史统计 |
slabtop |
内核 slab 分配器统计 |
/proc/meminfo |
各种文件系统和缓存统计 |
8.6.10. sar
$ sar -v 1

05:50:31 PM dentunusd   file-nr  inode-nr    pty-nr
05:50:32 PM     34510      2720     50212         4
05:50:33 PM     34510      2720     50212         4
05:50:34 PM     34510      2720     50212         4
05:50:35 PM     34510      2720     50212         4
dentunusd:未使用的目录条目缓存(directory entry cache)的数量(即可用数量)file-nr:已使用的文件句柄(file handles)的数量inode-nr:已使用的 inode 数量
8.6.11. slabtop
slabtop 的输出中包含了一些文件系统缓存相关的信息:
$ slabtop -sc
 Active / Total Objects (% used)    : 543810 / 560981 (96.9%)
 Active / Total Slabs (% used)      : 11562 / 11562 (100.0%)
 Active / Total Caches (% used)     : 102 / 143 (71.3%)
 Active / Total Size (% used)       : 143821.87K / 149482.23K (96.2%)
 Minimum / Average / Maximum Object : 0.01K / 0.27K / 8.00K

  OBJS ACTIVE  USE OBJ SIZE  SLABS OBJ/SLAB CACHE SIZE NAME
 36305  35544  97%    0.59K    685       53     21920K inode_cache
 13369  12010  89%    1.07K    461       29     14752K ext4_inode_cache
103080 100524  97%    0.13K   1718       60     13744K kernfs_node_cache
 71274  65417  91%    0.19K   1697       42     13576K dentry
 12096  10238  84%    0.57K    216       56      6912K radix_tree_node
  1656   1648  99%    4.00K    207        8      6624K kmalloc-4k
上面部分是整体统计,下面部分是按类型统计:
dentry: dentry cache(目录缓存)inode_cache: inode cacheext3_inode_cache: inode cache for ext3ext4_inode_cache: inode cache for ext4
能够看到每种类型的:
OBJS:内存对象数量ACTIVE:活跃对象数量USE:使用率(1 - USE应该是等待回收的比例)OBJ SIZE:对象大小SLABS:slab 数量OBJ/SLAB:平均每个 slab 的对象数量CACHE SIZE:缓存大小
8.6.14. /proc/meminfo
/proc/meminfo 提供了内存使用的分解视图,free 等工具会读取这个文件:
$ cat /proc/meminfo
MemTotal:        6138400 kB
MemFree:         5269392 kB
MemAvailable:    5431204 kB
Buffers:           46720 kB
Cached:           293448 kB
SwapCached:            0 kB
Active:           436036 kB
Inactive:         176372 kB
Active(anon):     272468 kB
...
Buffers:buffer cacheCached:page cache
8.6.17. 其他工具
df(1): report file system usage and capacity statisticsmount(8): can show file system mounted options (static performance tuning)inotify: 一个监控(monitoring)文件系统事件的框架
8.7.1. Ad Hoc
- write:
dd if=/dev/zero of=file1 bs=1024k count=1k - read:
dd if=file1 of=/dev/null bs=1024k
$ dd if=/dev/zero of=/dev/null bs=1024k count=10k
10240+0 records in
10240+0 records out
10737418240 bytes (11 GB, 10 GiB) copied, 0.625901 s, 17.2 GB/s
8.7.2. Micro-Benchmark Tools
benchmark 工具:
- Bonnie
- Bonnie++
- iozone
- tiobench
- SysBench
- fio
- FileBench
$ fio --runtime=60 --time_based --clocksource=clock_gettime --name=randread --numjobs=1 \
  --rw=randread --random_distribution=pareto:0.9 --bs=8k --size=5g --filename=fio.tmp
8.7.3. Cache Flushing(清除缓存)
在 benchmarking 的时候,需要清除缓存。
命令:
- 清除 pagecache:
echo 1 > /proc/sys/vm/drop_caches - 清除 dentries and inodes:
echo 2 > /proc/sys/vm/drop_caches - 清除 pagecache, dentries and inodes:
echo 3 > /proc/sys/vm/drop_caches
更多信息见内核文档 Documentation/sysctl/vm.txt。
9. Disk
9.3.2. Time Scales
表 9-1. 磁盘事件耗时
| 事件 | 耗时 | 相对值 |
|---|---|---|
| 磁盘缓存命中 | < 100 us |
1 秒 |
| Flash 内存读 | 100~1000 us(small~large I/O) |
1~10 秒 |
| 旋转磁盘顺序读 | ~1 ms |
10 秒 |
| 旋转磁盘随机读(7200 转) | ~8 ms |
1.3 分 |
| 旋转磁盘随机读(slow, queueing) | > 10 ms |
1.7 分 |
| 旋转磁盘随机读(dozens in queue) | > 100 ms |
17 分 |
| 最坏情况下的虚拟磁盘 I/O(硬件控制器、RAID-5、queueing、随机 I/O) | > 1000 ms |
2.8 小时 |
9.4.2. 磁盘接口类型
-
SCSI(Small Computer System Interface)
- 一种并行传输总线(parallel transport bus)
- using multiple electrical connectors to transport bits in parallel
-
SAS(Serial Attached SCSI)
- high-speed point-to-point transport
- 避免了 SCSI 的总线竞争问题(bus contention)
-
SATA(Serial ATA)
- 避免了 SCSI 的总线竞争问题(bus contention)
9.4.3. Storage Types
常见架构:
- disk devices
- RAID
- storage arrays
- network-attached storage (NAS)
9.4.4. 磁盘 IO 栈
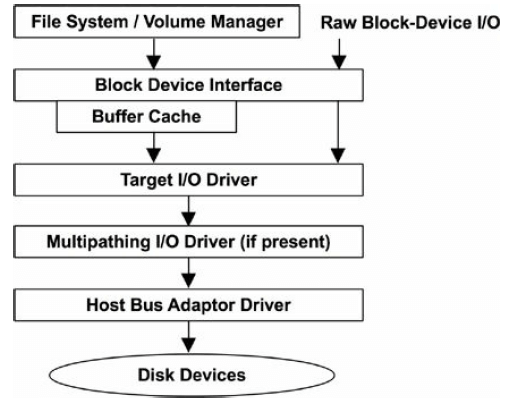
图 9-6. 常规磁盘 I/O 栈
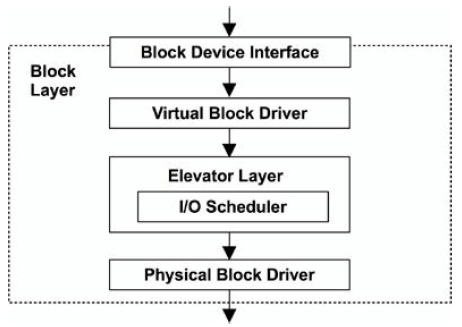
图 9-7. Linux 块层(block layer)
elevator seeking algorithm:
- reduce rotation disk head travel (sorting of pending I/O based on their location)
- 合并 I/O(merge and coalesce I/O)
9.6. Analysis
表 9-5. 磁盘事件耗时
| 工具 | 简介 |
|---|---|
iostat |
各种磁盘统计 |
sar |
磁盘历史数据统计 |
pidstat, iotop |
进程级别的磁盘统计 |
blktrace |
磁盘 I/O 事件跟踪 |
DTrace |
自定义静态和动态跟踪 |
MegaCli |
LSI 控制器统计 |
smartctl |
磁盘控制器统计 |
9.6.1. iostat
iostat 打印 per-disk I/O 信息,这通常是排查磁盘问题时执行的第一个命令。
这些信息由内核维护,因此 iostat 的开销比较低(读取内核文件开销)。
$ iostat
Linux 5.4.15-1.el7.elrepo.x86_64 (node01)         04/30/2020      _x86_64_        (32 CPU)

avg-cpu:  %user   %nice %system %iowait  %steal   %idle
           0.40    0.00    0.25    0.00    0.00   99.35

Device:            tps    kB_read/s    kB_wrtn/s    kB_read    kB_wrtn
sda              14.34         1.25       299.90    6991174 1675623268
sdb               4.91         1.19       547.29    6633823 3057875140
tps: transactions per second (IOPS)
参数:
-c:打印 CPU 信息-d:打印 disk 信息-k:单位 KB-m:单位 MB-p:包含 per-partition 统计信息-t:打印时间戳-x:打印扩展信息-z:不打印 zero-activity 信息
$ iostat -dkxz 1

Device:  rrqm/s   wrqm/s    r/s     w/s  rkB/s   wkB/s avgrq-sz avgqu-sz   await r_await w_await  svctm  %util
sda        0.00     0.43   0.02   14.32   1.25  299.91    41.99     0.00    0.07    3.09    0.06   0.06   0.09
sdb        0.00     0.24   0.08    4.82   1.19  547.34   223.60     0.00    0.17    1.18    0.15   0.36   0.18

Device:  rrqm/s   wrqm/s    r/s     w/s  rkB/s   wkB/s avgrq-sz avgqu-sz   await r_await w_await  svctm  %util
sda        0.00     0.00   0.00    6.00   0.00  788.00   262.67     0.00    0.17    0.00    0.17   0.33   0.20

Device:  rrqm/s   wrqm/s    r/s     w/s  rkB/s   wkB/s avgrq-sz avgqu-sz   await r_await w_await  svctm  %util

Device:  rrqm/s   wrqm/s    r/s     w/s  rkB/s   wkB/s avgrq-sz avgqu-sz   await r_await w_await  svctm  %util
sda        0.00     0.00   0.00    7.00   0.00  868.00   248.00     0.00    0.00    0.00    0.00   0.43   0.30
...
rrqm/s: 驱动请求队列里每秒合并(merged)的读请求(placed on driver request queue and merged)wrqm/s: 驱动请求队列里每秒合并(merged)的写请求r/s: 每秒发送到磁盘设备的读请求(issued to the disk device)w/s: 每秒发送到磁盘设备的写请求avgrq-sz: 平均请求大小,单位:扇区(512 bytes)avgqu-sz: 平均请求数量,包括在驱动请求队列中等待的,以及设备上活跃的请求(active on the device)await: 平均 I/O 响应时间,包括在队列等待的时间,以及设备的 I/O 响应时间,单位msr_await: same as await, but for reads only (ms)w_await: same as await, but for writes only (ms)svctm: 平均(计算出的)设备 I/O 响应时间,这一列将来会删除%util: 磁盘忙于处理 I/O 请求的时间百分比(利用率)
说明:
rrqm/s和wrqm/s非零表明有持续的请求合并,能够提升性能。这个指标也 表明有大量顺序操作(顺序读、顺序写)r/s和w/s是真实发送到设备的请求数量- 由于
avgrq-sz是合并之后的平均请求大小,因此这个值- 较小时(
< 16 sectors):暗示有大量的随机 I/O 请求,因为它们无法被合并 - 较大时:暗示有 large I/O,或是合并之后的顺序请求(是否是顺序请求可参考
rrqm/s、wrqms/)
- 较小时(
await是最重要的性能指标- 如果是异步写模式,
w_await指标参考价值不大
- 如果是异步写模式,
%util是资源利用率和容量规划会用到的指标- 但注意,这只是一个衡量磁盘繁忙程度(non-idle time)的指标,对物理设备来说 会比较有意义,但对虚拟设备来说参考价值可能不大
- 虚拟设备的性能可用 IOPS (
r/s+w/s) 和 throughput (rkB/s+wkB/s) 来衡量
$ iostat -dkxzt -p ALL 1

04/30/2020 09:11:36 AM
Device:  rrqm/s  wrqm/s    r/s    w/s  rkB/s    wkB/s avgrq-sz avgqu-sz  await r_await w_await  svctm  %util
sda        0.00    0.43   0.02  14.32   1.25   299.92    41.99     0.00   0.07    3.09    0.06   0.06   0.09
sda1       0.00    0.00   0.00   0.00   0.12     0.00   132.68     0.00   0.37    0.37    0.15   0.27   0.00
sda2       0.00    0.43   0.02  14.32   0.96   299.91    41.97     0.00   0.07    3.21    0.06   0.06   0.09
sdb        0.00    0.24   0.08   4.83   1.19   547.44   223.60     0.00   0.17    1.18    0.15   0.36   0.18

04/30/2020 09:11:37 AM
Device:  rrqm/s  wrqm/s    r/s    w/s  rkB/s    wkB/s avgrq-sz avgqu-sz  await r_await w_await  svctm  %util
sda        0.00    0.00   0.00   6.00   0.00   792.00   264.00     0.00   0.00    0.00    0.00   0.17   0.10
sda2       0.00    0.00   0.00   6.00   0.00   792.00   264.00     0.00   0.17    0.00    0.17   0.17   0.10
参数:
-p ALL打印 per-partition 统计信息
9.6.2. sar
-d 打印磁盘统计信息:
$ sar -d 1
Linux 5.4.0-26-generic (ubuntu)         04/30/2020      _x86_64_        (4 CPU)

09:22:09 AM       DEV     tps   rkB/s  wkB/s   dkB/s   areq-sz    aqu-sz     await     %util
09:22:10 AM    dev7-0    0.00    0.00   0.00    0.00      0.00      0.00      0.00      0.00
09:22:10 AM    dev7-1    0.00    0.00   0.00    0.00      0.00      0.00      0.00      0.00
09:22:10 AM   dev11-0    0.00    0.00   0.00    0.00      0.00      0.00      0.00      0.00
09:22:10 AM   dev11-1    0.00    0.00   0.00    0.00      0.00      0.00      0.00      0.00
09:22:10 AM    dev8-0    0.00    0.00   0.00    0.00      0.00      0.00      0.00      0.00

09:22:10 AM       DEV     tps   rkB/s  wkB/s   dkB/s   areq-sz    aqu-sz     await     %util
09:22:11 AM    dev7-0    0.00    0.00   0.00    0.00      0.00      0.00      0.00      0.00
09:22:11 AM    dev7-1    0.00    0.00   0.00    0.00      0.00      0.00      0.00      0.00
...
tps: device data transfers per secondrd_sec/s,wr_sec/s: read and write sectors (512 bytes) per second
9.6.3. pidstat
-d 打印每个进程的磁盘 I/O 信息:
$ pidstat -d 1

09:27:44 AM   UID       PID   kB_rd/s   kB_wr/s kB_ccwr/s  Command
09:27:46 AM     0       783      0.00     11.65      0.00  systemd-journal
09:27:46 AM     0      1523      0.00      3.88      0.00  metricbeat
09:27:46 AM     0     69595      0.00      3.88      0.00  kubelet

09:27:46 AM   UID       PID   kB_rd/s   kB_wr/s kB_ccwr/s  Command
09:27:47 AM     0       783      0.00     24.00      0.00  systemd-journal
09:27:47 AM     0      1523      0.00      4.00      0.00  metricbeat
kB_ccwr/s:每秒取消的写大小(例如,在 flush 之前被 overwrite 了),单位 KB
只有 root 用户能打印所有进程的磁盘 I/O 信息,这些数据是从 /proc/<pid>/io 里读
取的。
9.6.6. perf
perf 事件:
$ perf list | grep block:
  block:block_bio_backmerge                          [Tracepoint event]
  block:block_bio_bounce                             [Tracepoint event]
  block:block_bio_complete                           [Tracepoint event]
  block:block_bio_frontmerge                         [Tracepoint event]
  block:block_bio_queue                              [Tracepoint event]
  block:block_bio_remap                              [Tracepoint event]
  block:block_dirty_buffer                           [Tracepoint event]
  block:block_getrq                                  [Tracepoint event]
  block:block_plug                                   [Tracepoint event]
  block:block_rq_complete                            [Tracepoint event]
  block:block_rq_insert                              [Tracepoint event]
  block:block_rq_issue                               [Tracepoint event]
  block:block_rq_remap                               [Tracepoint event]
  block:block_rq_requeue                             [Tracepoint event]
  block:block_sleeprq                                [Tracepoint event]
  block:block_split                                  [Tracepoint event]
  block:block_touch_buffer                           [Tracepoint event]
  block:block_unplug                                 [Tracepoint event]
跟踪块设备读请求:
$ perf record -age block:block_rq_issue sleep 10
[ perf record: Woken up 4 times to write data ]
[ perf record: Captured and wrote 0.817 MB perf.data (~35717 samples) ]

$ perf report | more
[...]
  100.00% tar [kernel.kallsyms] [k] blk_peek_request
          |
          --- blk_peek_request
              do_virtblk_request
              blk_queue_bio
              generic_make_request
              submit_bio
              submit_bh
             |
             |--100.00%-- bh_submit_read
             |            ext4_ext_find_extent
             |            ext4_ext_map_blocks
             |            system_call
             |            __getdents64
9.6.7. iotop
默认 5s 输出一次,单位是字节:
$ sudo iotop
Total DISK READ:         0.00 B/s | Total DISK WRITE:         0.00 B/s
Current DISK READ:       0.00 B/s | Current DISK WRITE:       0.00 B/s
    TID  PRIO  USER     DISK READ  DISK WRITE  SWAPIN     IO>    COMMAND
   7262 be/4 root        0.00 B/s    0.00 B/s  0.00 %  0.01 % [kworker/u128:0-events_power_efficient]
      1 be/4 root        0.00 B/s    0.00 B/s  0.00 %  0.00 % init auto noprompt
      2 be/4 root        0.00 B/s    0.00 B/s  0.00 %  0.00 % [kthreadd]
      3 be/0 root        0.00 B/s    0.00 B/s  0.00 %  0.00 % [rcu_gp]
      4 be/0 root        0.00 B/s    0.00 B/s  0.00 %  0.00 % [rcu_par_gp]
      6 be/0 root        0.00 B/s    0.00 B/s  0.00 %  0.00 % [kworker/0:0H-kblockd]
      8 be/0 root        0.00 B/s    0.00 B/s  0.00 %  0.00 % [mm_percpu_wq]
      9 be/4 root        0.00 B/s    0.00 B/s  0.00 %  0.00 % [ksoftirqd/0]
参数:
-a:累计 I/O,而不是平均 I/O-o:只显示在执行 I/O 任务的进程-b:batch 模式,provide a rolling output (no screen clear)
下面的例子 5s 打印一次,只显示活跃 I/O 进程:
$ iotop -bod5
Total DISK READ :       0.00 B/s | Total DISK WRITE :       0.00 B/s
Actual DISK READ:       0.00 B/s | Actual DISK WRITE:       0.00 B/s
   TID  PRIO  USER     DISK READ  DISK WRITE  SWAPIN      IO    COMMAND

Total DISK READ :       0.00 B/s | Total DISK WRITE :     215.68 K/s
Actual DISK READ:       0.00 B/s | Actual DISK WRITE:       4.09 M/s
   TID  PRIO  USER     DISK READ  DISK WRITE  SWAPIN      IO    COMMAND
  3659 be/4 root        0.00 B/s   32.16 K/s  0.00 %  0.02 % dockerd -H unix://
 59689 be/4 root        0.00 B/s    0.00 B/s  0.00 %  0.01 % [kworker/u130:0-xfs-cil/dm-0]
 47819 be/4 root        0.00 B/s   14.90 K/s  0.00 %  0.01 % dockerd -H unix://
 69883 be/4 root        0.00 B/s    4.71 K/s  0.00 %  0.00 % kubelet --cni-bin-dir=/opt/cni/bin
9.6.9. blktrace
blktrace(8) 是一套跟踪基础设施,
- 内核跟踪模块, 缓存(buffer)数据 (which was later moved to tracepoints)
- 给用户空间工具用的控制和汇报机制:这些工具包括
blktrace(8):内核跟踪,获取原始跟踪数据blkparse(1):解析跟踪数据btrace(8):调用blktrace和blkparse,与二者等价,但命令更短
$ sudo blktrace -d /dev/sda -o - | blkparse -i -
  8,0    3        1     0.000000000  7111  A  WM 1052736 + 8 <- (8,5) 64
  8,0    3        2     0.000001483  7111  Q  WM 1052736 + 8 [kworker/u128:1]
  8,0    3        3     0.000008698  7111  G  WM 1052736 + 8 [kworker/u128:1]
  8,0    3        4     0.000009741  7111  P   N [kworker/u128:1]
^CCPU2 (8,0):
 Reads Queued:           0,        0KiB  Writes Queued:           6,       24KiB
 Read Dispatches:        0,        0KiB  Write Dispatches:        2,       24KiB
 Reads Requeued:         0               Writes Requeued:         0
 Reads Completed:        0,        0KiB  Writes Completed:        2,       24KiB
 Read Merges:            0,        0KiB  Write Merges:            4,       16KiB
 Read depth:             0               Write depth:            12
 IO unplugs:             1               Timer unplugs:           0
CPU3 (8,0):
 ...
 IO unplugs:             1               Timer unplugs:           4

Total (8,0):
 Reads Queued:           0,        0KiB  Writes Queued:          46,      196KiB
 Read Dispatches:        0,        0KiB  Write Dispatches:       38,      196KiB
 Reads Requeued:         0               Writes Requeued:         0
 Reads Completed:        0,        0KiB  Writes Completed:       38,      196KiB
 Read Merges:            0,        0KiB  Write Merges:            8,       32KiB
 IO unplugs:             2               Timer unplugs:           4

Throughput (R/W): 0KiB/s / 33KiB/s
Events (8,0): 264 entries
Skips: 0 forward (0 -   0.0%)
每列的含义:
- Device major, minor number
- CPU ID
- Sequence number
- Action time, in seconds
- Process ID
- Action identifier (see below)
- RWBS description: may include R (read), W (write), D (block discard), B (barrier operation), S (synchronous)
可以用 -f 指定显示哪些列。
最后一列数据表示的意思因 action 而异。例如 184773879 + 8 [cksum] 表示:
- 块地址 184773879 处的 I/O
- 大小为 8 (sectors)
- 来自名为 chsum 的进程
Action Identifiers
来自 blkparse(1) man page:
A IO was remapped to a different device
B IO bounced
C IO completion
D IO issued to driver
F IO front merged with request on queue
G Get request
I IO inserted onto request queue
M IO back merged with request on queue
P Plug request
Q IO handled by request queue code
S Sleep request
T Unplug due to timeout
U Unplug request
X Split
Action Filtering
blktrace(8) 和 btrace(8) 可以过滤事件类型。 例如,只跟踪 D actions (I/O issued), use the filter option -a issue:
$ sudo btrace -a issue /dev/sda
  8,0    1        1     0.000000000   373  D  WM 1052736   + 8 [kworker/1:1H]
  8,0    1        2     0.000136747   373  D  WM 1052752   + 8 [kworker/1:1H]
  8,0    1        3     0.000175394   373  D   W 1249512   + 8 [kworker/1:1H]
  8,0    1        5     0.000243063   373  D  WM 126881808 + 8 [kworker/1:1H]
  8,0    1        8     0.000352939   373  D  WM 152050152 + 8 [kworker/1:1H]
其他 filters 见 blktrace(8) man page,例如
- trace only reads (-a read)
- trace only writes (-a write)
- synchronous operations (-a sync)
9.6.11. smartctl
一些现代设备提供 SMART (Self-Monitoring, Analysis and Reporting Technology) 数据 ,其中包含了很多健康信息。
smartctl(8) 能显示此类信息:
$ sudo smartctl --all /dev/sda
smartctl 7.1 2019-12-30 r5022 [x86_64-linux-5.4.0-26-generic] (local build)
Copyright (C) 2002-19, Bruce Allen, Christian Franke, www.smartmontools.org

=== START OF INFORMATION SECTION ===
Vendor:               VMware,
Product:              VMware Virtual S
Revision:             1.0
User Capacity:        85,899,345,920 bytes [85.8 GB]
Logical block size:   512 bytes
Rotation Rate:        Solid State Device
Device type:          disk
Local Time is:        Thu Apr 30 09:49:51 2020 CST
SMART support is:     Unavailable - device lacks SMART capability.

=== START OF READ SMART DATA SECTION ===
Current Drive Temperature:     0 C
Drive Trip Temperature:        0 C

Error Counter logging not supported

Device does not support Self Test logging
Accessing the first disk in a virtual RAID device, using -d megaraid,0:
$ smartctl --all -d megaraid,0 /dev/sdb
9.7. Experimentation
9.7.1. Ad Hoc
dd(1):device-to-device copy。
$ sudo dd if=/dev/sda1 of=/dev/null bs=1024k count=1k
512+0 records in
512+0 records out
536870912 bytes (537 MB, 512 MiB) copied, 2.57553 s, 208 MB/s
9.7.3. Micro-Benchmark Tools
磁盘 benchmark 工具 hdparm(8):
-T:tests cached reads-t:tests disk device reads
$ sudo hdparm -Tt /dev/sda

/dev/sda:
 Timing cached reads:   13376 MB in  1.99 seconds = 6708.47 MB/sec
 Timing buffered disk reads: 588 MB in  3.01 seconds = 195.50 MB/sec
可以看到缓存是否命中对性能影响非常大。
9.8. Tuning
9.8.1. Operating System Tunables
These include ionice(1), resource controls, and kernel tunable parameters.
ionice
ionice 为一个进程设置 I/O scheduling class and priority。
scheduling classes:
0, none: no class specified, so the kernel will pick a default—best effort, with a priority based on the process nice value.1, real-time: highest-priority access to the disk. If misused, this can starve other processes (just like the RT CPU scheduling class).2, best effort: default scheduling class, supporting priorities 0–7, with 0 the highest.3, idle: disk I/O allowed only after a grace period of disk idleness.
Here is example usage:
$ ionice -c 3 -p 1623
This puts process ID 1623 in the idle I/O scheduling class. This may be desirable for long-running backup jobs, so that they are less likely to interfere with the production workload.
Tunable Parameters
/sys/block/sda/queue/scheduler:设置 I/O scheduler policy,可选- noop
- deadline
- an (anticipatory)
- cfq
10. Network
10.3.5 Latency
表 10-1. 不同距离的 Ping 延迟
| From | To | Via | Latency | Scaled |
|---|---|---|---|---|
| Localhost | localhost | kernel | 0.05 ms |
1 秒 |
| Host | host (same subnet) | 10 GbE | 0.2 ms |
4 秒 |
| Host | host (same subnet) | 1 GbE | 0.6 ms |
11 秒 |
| Host | host (same subnet) | WiFi | 3 ms |
1 分钟 |
| San Francisco | New York | Internet | 40 ms |
13 分钟 |
| San Francisco | UK | Internet | 81 ms |
27 分钟 |
| San Francisco | Australia | Internet | 183 ms |
1 小时 |
10.4.1 Protocols
Congestion Control: Reno and Tahoe
These algorithms for congestion control were first implemented in 4.3BSD:
- Reno: triple duplicate ACKs trigger: halving of the congestion window, halving of the slowstart threshold, fast retransmit, and fast recovery
- Tahoe: triple duplicate ACKs trigger: fast retransmit, halving the slow-start threshold, congestion window set to one maximum segment size (MSS), and slow-start state Some operating systems (e.g., Linux and Oracle Solaris 11) allow the algorithm to be selected as part of system tuning. Newer algorithms that have been developed for TCP include Vegas, New Reno, and Hybla.
Nagle
This algorithm [RFC 896] reduces the number of small packets on the network by delaying their transmission to allow more data to arrive and coalesce. This delays packets only if there is data in the pipeline and delays are already being encountered.
SACK and FACK
The TCP selective acknowledgment (SACK) algorithm allows the receiver to inform the sender that it received a noncontiguous block of data. Without this, a packet drop would eventually cause the entire send window to be retransmitted, to preserve a sequential acknowledgment scheme. This harms TCP performance and is avoided by most modern operating systems that support SACK.
SACK has been extended by forward acknowledgments (FACK), which are supported in Linux by default. FACKs track additional state and better regulate the amount of outstanding data in the network, improving overall performance [Mathis 96].
10.4.3 Software
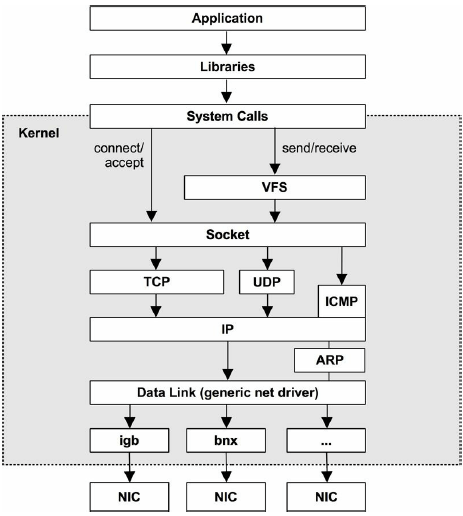
图 10-7. Generic network IP stack
10.6. Analysis
10.6.1. netstat
参数:
- 默认:列出所有 connected sockets
-a:所有 sockets-s:网络栈统计-i:网络接口(网卡)统计-r:打印路由表(route table)
$ netstat -i ens33
Kernel Interface table
Iface      MTU    RX-OK RX-ERR RX-DRP RX-OVR    TX-OK TX-ERR TX-DRP TX-OVR Flg
ens33     1500   160329      0      0 0        211868      0      0      0 BMRU
lo       65536     1571      0      0 0          1571      0      0      0 LRU
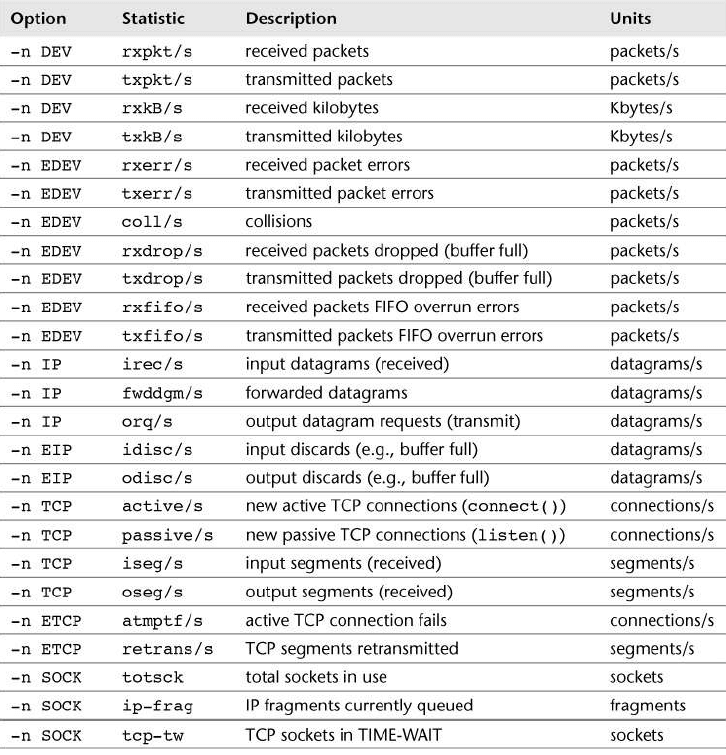
10.6.2. sar
参数:
-n DEV: 网络接口统计-n EDEV: 网络接口错误(errors)-n IP: IP 统计-n EIP: IP 错误统计-n TCP: TCP 统计-n ETCP: TCP 错误统计-n SOCK: socket 使用情况
$ sar -n TCP 1

10:31:56 AM  active/s passive/s    iseg/s    oseg/s
10:31:57 AM      0.00      0.00      0.99      0.99
10:31:58 AM      0.00      0.00      1.00      1.00
10:31:59 AM      0.00      0.00      1.00      1.00
10:32:00 AM      0.00      0.00      1.00      1.00
只看 eth0 的统计:
$ sar -n DEV 1 | awk '/eth0/'
10:34:30 AM      eth0      3.00      0.00      0.20      0.00      0.00      0.00      3.00
10:34:31 AM      eth0      5.00      0.00      0.38      0.00      0.00      0.00      4.00
10:34:32 AM      eth0      3.00      0.00      0.20      0.00      0.00      0.00      3.00
10.6.8. traceroute
10.6.15. perf
类型:
- skb tracepoints:用于 socket buffer events
- net tracepoints:网络设备
perf list | egrep "skb:|net:"
  net:napi_gro_frags_entry                           [Tracepoint event]
  net:napi_gro_frags_exit                            [Tracepoint event]
  net:napi_gro_receive_entry                         [Tracepoint event]
  net:napi_gro_receive_exit                          [Tracepoint event]
  net:net_dev_queue                                  [Tracepoint event]
  net:net_dev_start_xmit                             [Tracepoint event]
  net:net_dev_xmit                                   [Tracepoint event]
  net:net_dev_xmit_timeout                           [Tracepoint event]
  net:netif_receive_skb                              [Tracepoint event]
  net:netif_receive_skb_entry                        [Tracepoint event]
  net:netif_receive_skb_exit                         [Tracepoint event]
  net:netif_receive_skb_list_entry                   [Tracepoint event]
  net:netif_receive_skb_list_exit                    [Tracepoint event]
  net:netif_rx                                       [Tracepoint event]
  net:netif_rx_entry                                 [Tracepoint event]
  net:netif_rx_exit                                  [Tracepoint event]
  net:netif_rx_ni_entry                              [Tracepoint event]
  net:netif_rx_ni_exit                               [Tracepoint event]
  skb:consume_skb                                    [Tracepoint event]
  skb:kfree_skb                                      [Tracepoint event]
  skb:skb_copy_datagram_iovec                        [Tracepoint event]
例子:动态跟踪内核函数 tcp_sendmsg(),打印调用栈:
$ perf probe --add='tcp_sendmsg'
Added new event:
  probe:tcp_sendmsg    (on tcp_sendmsg)

You can now use it in all perf tools, such as:

        perf record -e probe:tcp_sendmsg -aR sleep 1

$ perf record -e probe:tcp_sendmsg -aR -g sleep 5
[ perf record: Woken up 1 times to write data ]
[ perf record: Captured and wrote 0.707 MB perf.data (107 samples) ]
$ perf report --stdio

# Children      Self  Trace output
# ........  ........  ..................
#
   100.00%   100.00%  (ffffffff817e5640)
            |
            |--76.64%--runtime.goexit
            |          |
            |          |--73.83%--k8s.io/apimachinery/pkg/watch.(*StreamWatcher).receive
            |          |          k8s.io/client-go/rest/watch.(*Decoder).Decode
            |          |          k8s.io/apimachinery/pkg/runtime/serializer/streaming.(*decoder).Decode
            |          |          k8s.io/apimachinery/pkg/util/framer.(*lengthDelimitedFrameReader).Read
            |          |          io.ReadAtLeast
            |          |          net.(*conn).Write
            |          |          net.(*netFD).Write
            |          |          internal/poll.(*FD).Write
...
#
# (Tip: To see list of saved events and attributes: perf evlist -v)
#
10.6.16. Other Tools
strace(1):跟踪 socket 相关的系统调用,(注意:开销很大)lsof(8):列出给定进程的所有已打开文件,其中有详细的 socket 信息ss(8):socket 统计nfsstat(8): NFS server and client statisticsiftop(8):网卡实时流量统计,按 host(IP 地址)分类(网络嗅探器 sniffer)/proc/net:包含很多网络相关的文件