Monitoring Docker Registry
We run a customized image service in our private cloud, which initially based on vmware/harbor 0.4.5, and developed internally since then. A public presentation PDF (in Chinease) has mentioned part of this[2]. This article, however, is not about the design and implementation of the image service (which needs another post), but the monitoring system along with it.
1 Introduction
To better understand the monitoring system, we first present the architecture overview.
1.1 Registry
Docker registry, now called Docker Distribution, is the official component
from Docker for storing and distributing Docker images. We use a customized
2.6+ version.
The customized part provides support for transparently redirecting requests to remote hubs/registrys (request origin) when local pull misses.
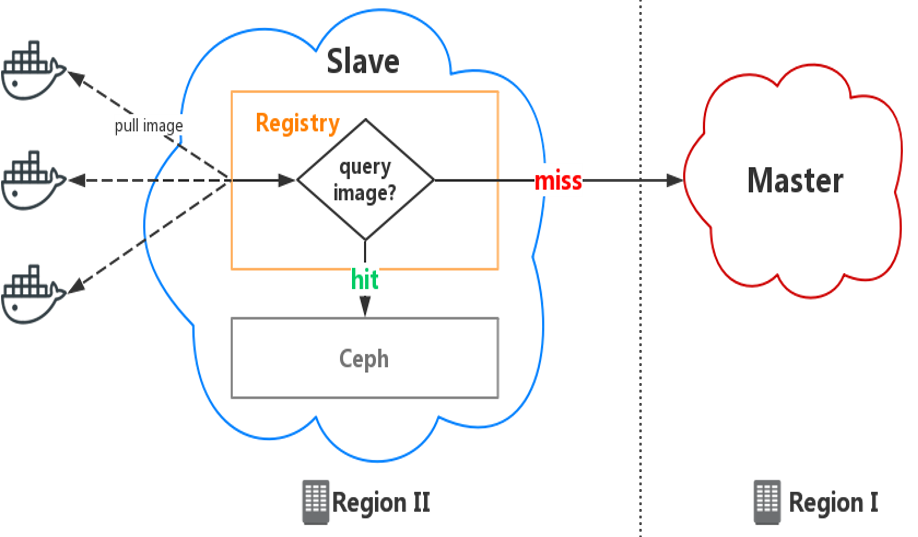
Pic from [2].
1.2 Hub
Registry provides functionalities such as image store, push/pull API, while leaves higher level mangements, such as user management, auth management, to upper platforms. Harbor is one of such platforms.
In our corp, we used a customized version to meet our specific needs, e.g. cross-region image sync, integration with CI/CD.
Main components of a hub:
- API and UI service
- Jobservice - perform image sync job
- registry - customized version
- nginx - L7 proxy between API/UI, jobservice, registry
Each hub is deployed with HA mode, architecture as follow:
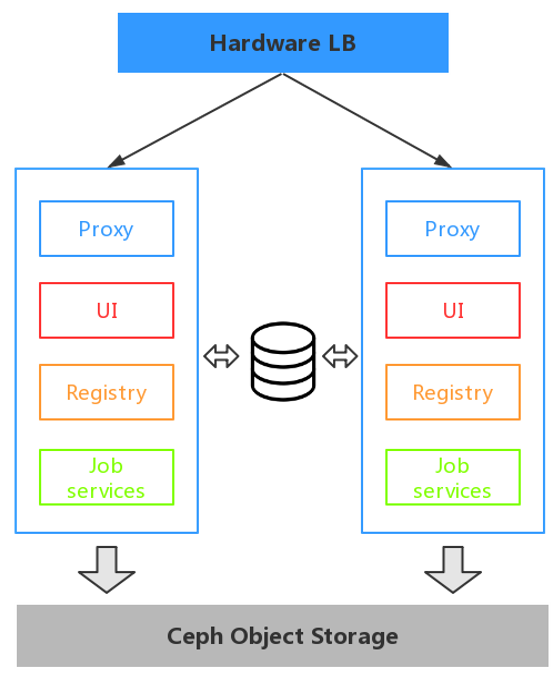
Pic from [2].
We have one hub per region, each with a distinct service URL, e.g hub-1.example.com, hub-2.example.com, hub-N.example.com.
For image service, however, we use a unique URL for all regions: hub.example.com, which dramatically speeds up push/pull performance.
We use gSLB to achieve this.
1.3 Fedoro
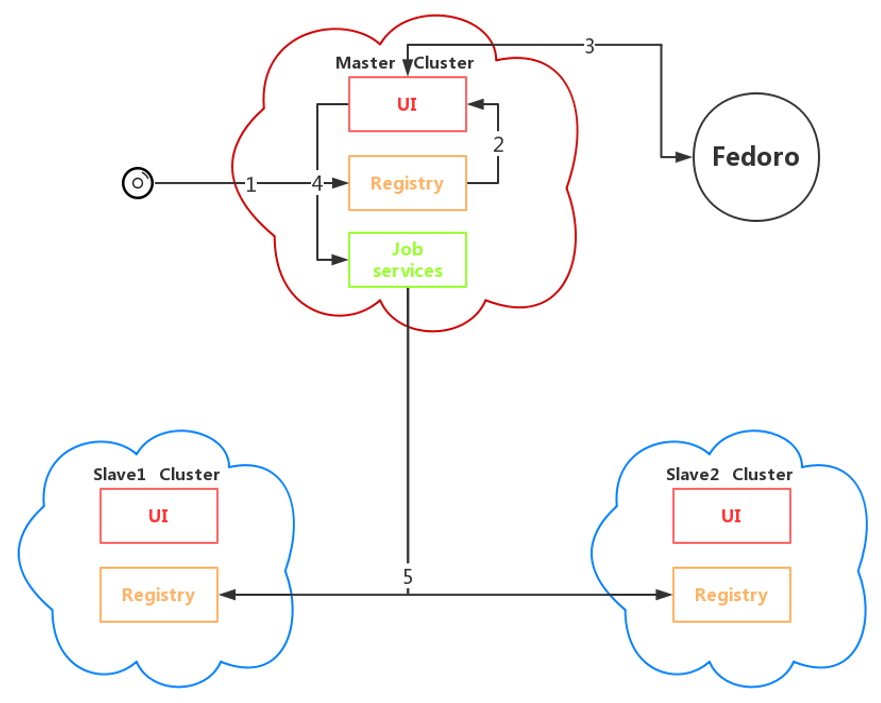
Pic from [2].
Fedoro is a central service to manage image sync. Fedoro makes hubs of different regions into a federation. It supports hub management, project management, and sync policy management.
2 Design
2.1 Tech Stack
Overall monitoring solution based on TIG: Telegraf + Influxdb + Grafana.
2.2 Metrics Source
We collect metrics mainly in two ways:
2.2.1. Matching Metric Patterns Against Access Log
- API status
- push/pull stats
- average push/pull bandwidth
2.2.2 Write Influxdb Format Metrics Directly To Files
- sync job info
- request origin info
3 Implementation
Docker pulls and pushes images by distinct layers, so currently we could only get the layer stats, not an entire image. But on our observation, each image takes roughly 3 layers.
3.1 Custom Patterns
To devide URI, we need define our own custom grok patterns.
Refer to [TODO] what pattern and custom pattern are.
3.2 Set tag Attribute
Set project to tag attribute
3.3 Select Limit
Grafana: add limit to tables. e.g. SELECT * FROM test LIMIT 500
4 Monitoring Dashboard
4.1 Key Metrics
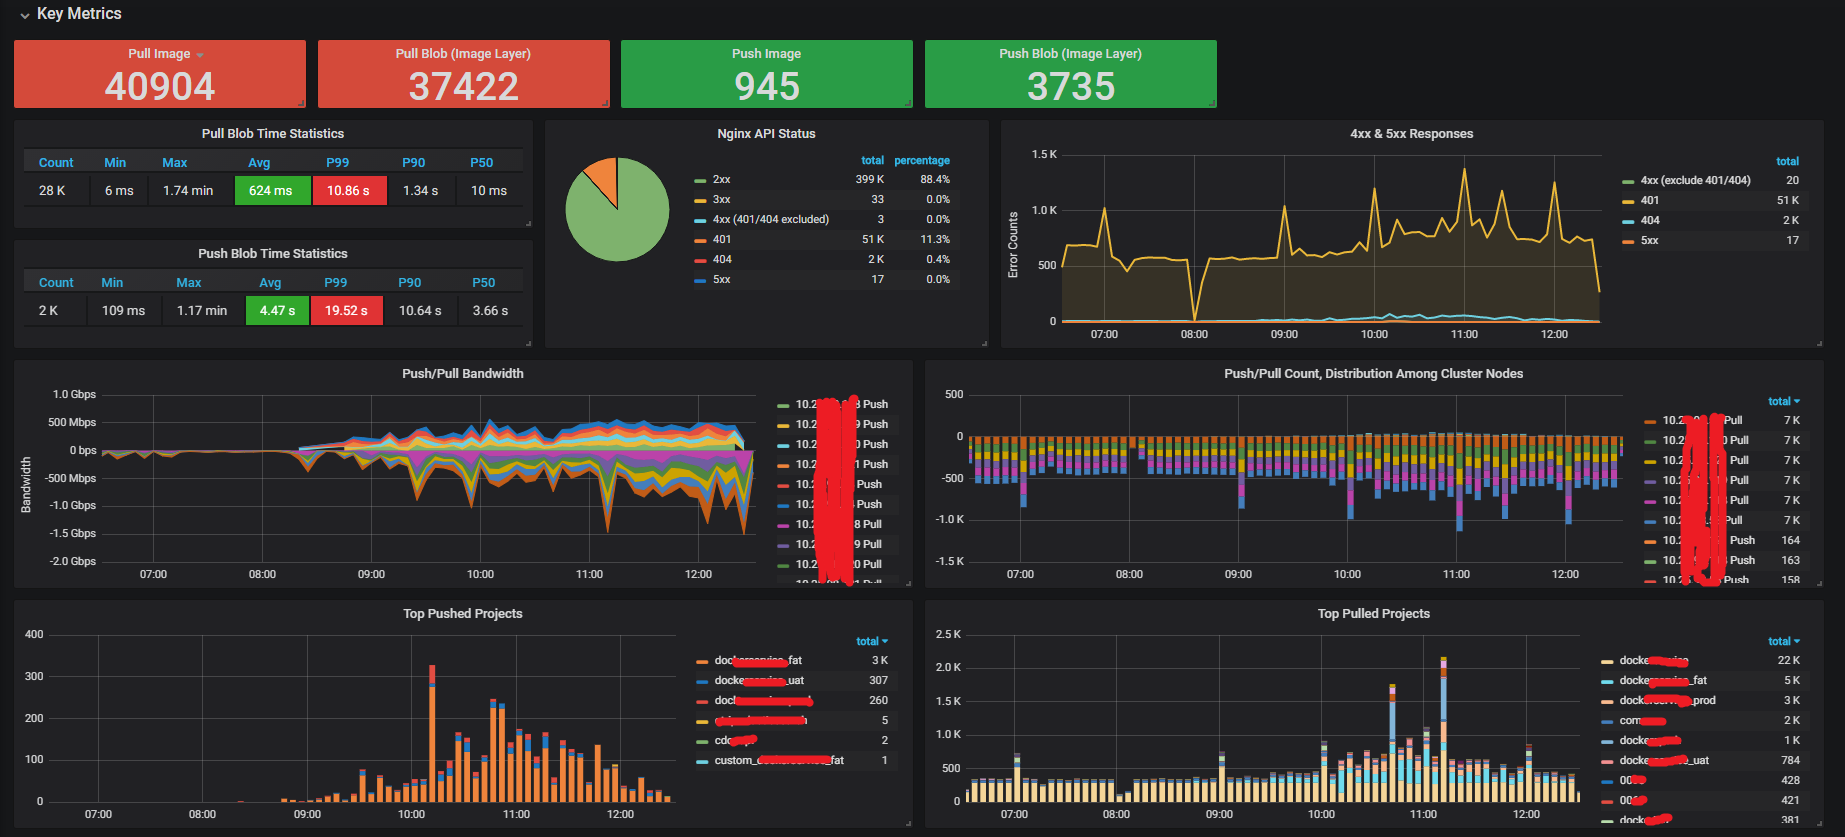
4.2 Error
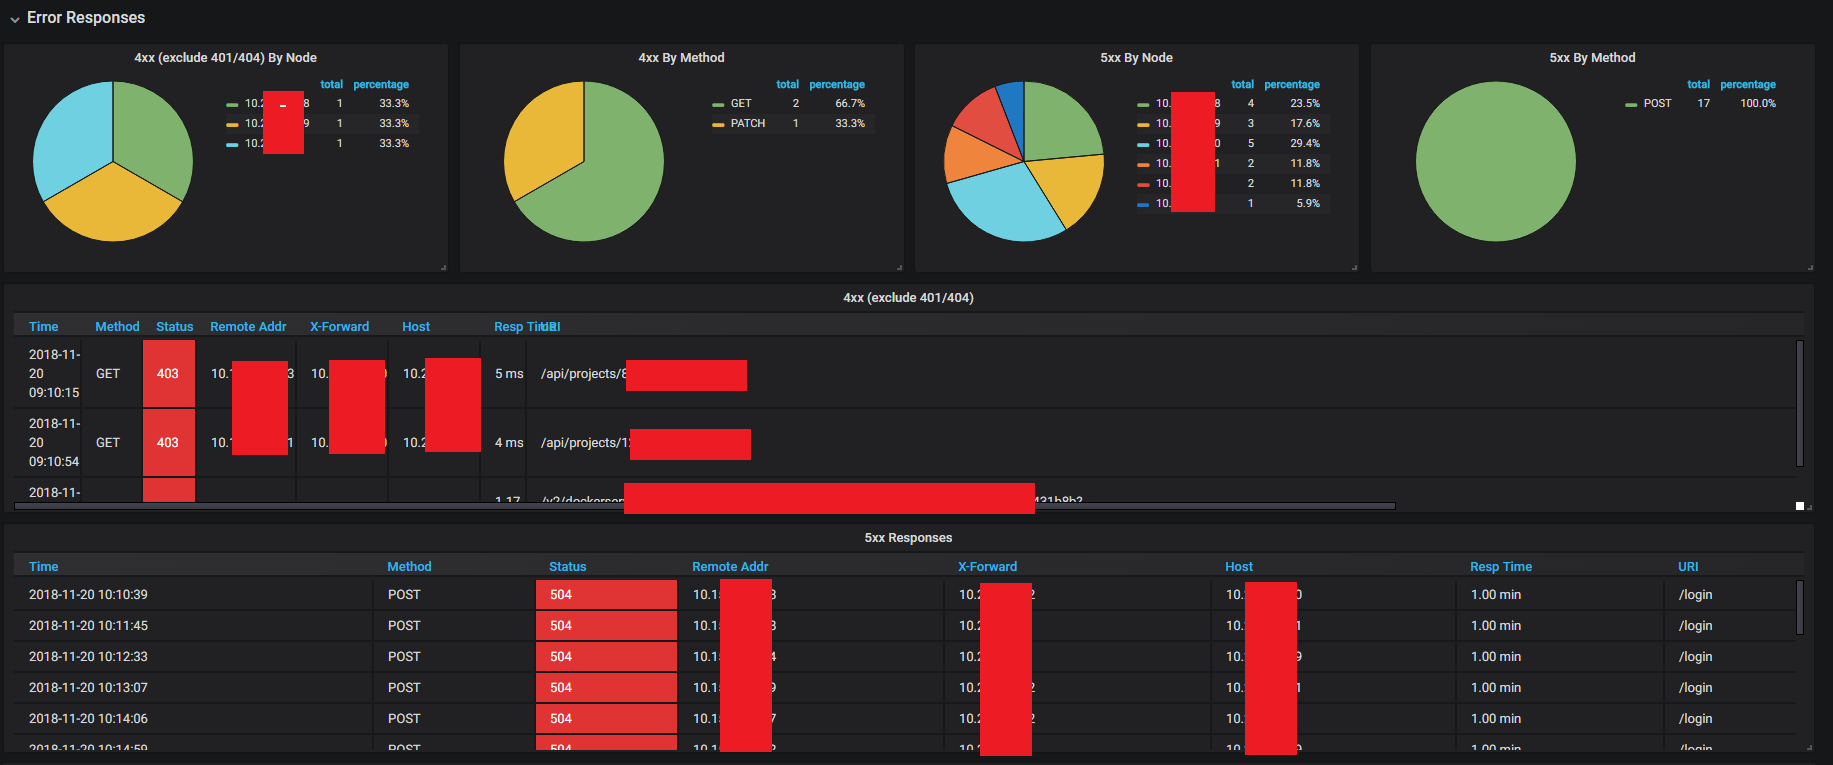
4.3 Slow Uploads/Downloads

4.4 Request Origin (Local Miss)
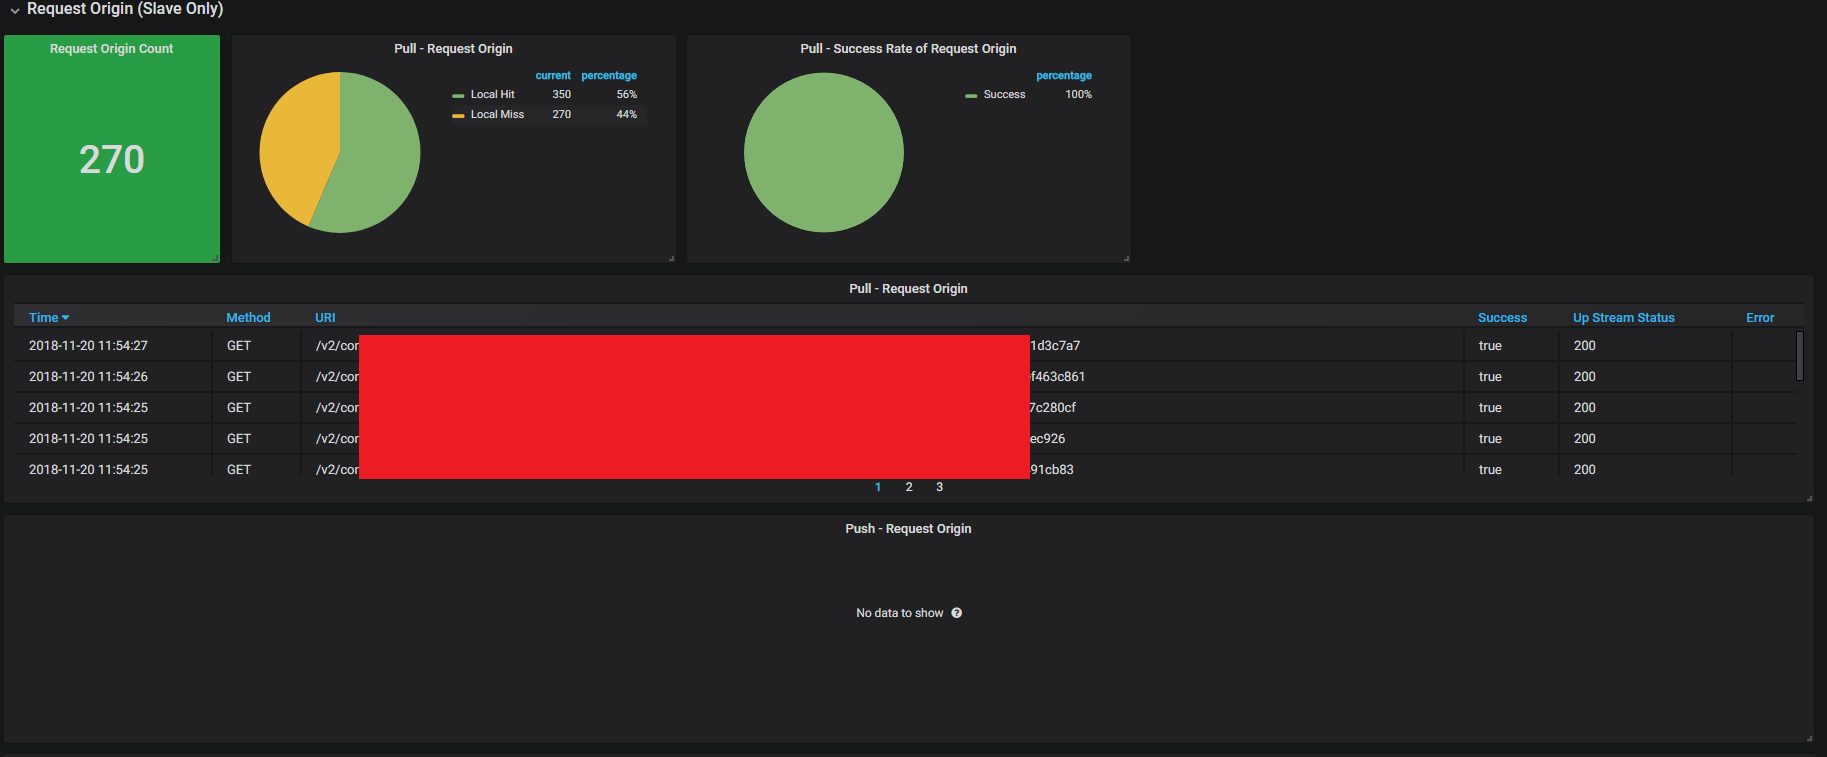
4.5 Log Details
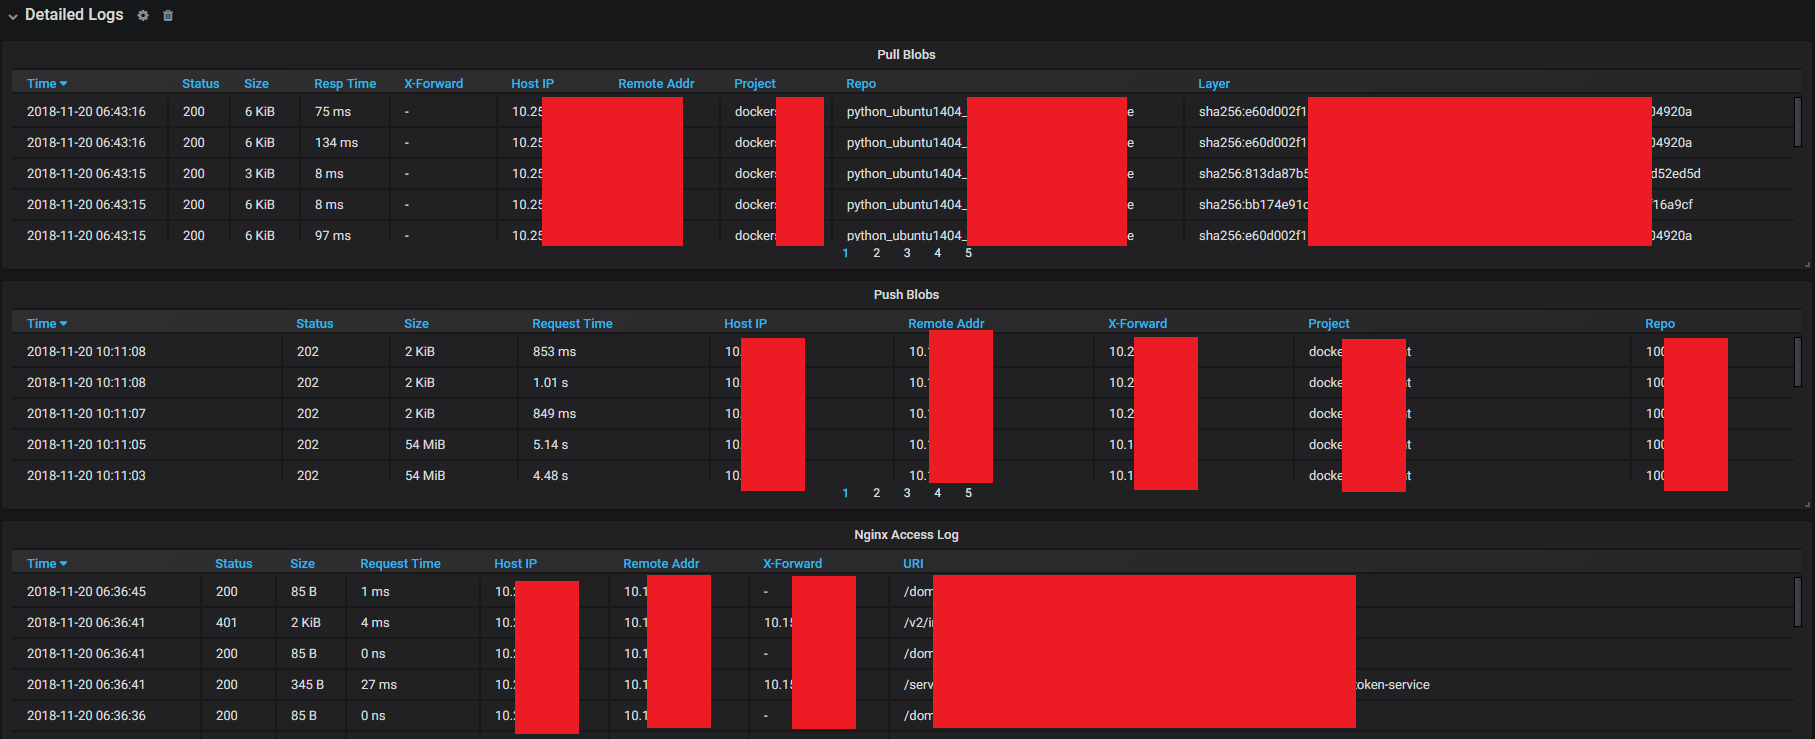
5 Alerting
6 Summary and Future Work
References
- Github: vmware/harbor
- 大浪:携程的容器化交付实践
- Github: Docker Registry
- What Is Global Server Load Balancing (GSLB)?
Appendix: Configuration Files
- Nginx Conf: nginx.conf
- Telegraf Conf: hub_nginx.conf
- Grafana Conf: grafana.json