Monitoring Ceph Object Storage
Ceph is a widely-used distributed file system which supports object storage, block storage, and distributed file system (Ceph FS).
We (Ctrip Cloud) use ceph to provide object storage service in our private cloud, with 10+ clusters (for historical reasons, each cluster is not very large), providing a total 10+ PB effective capacity.
Ceh is powerful and complicated, but it seems that there haven’t a corresponding monitoring solutions which is mature and widely used. In this article, we show our one for the object storage part.
1. Introduction
We provide object storage service through Swift and S3 APIs.
To better exhibit the cluster status, we design to collect the following metrics:
- Ceph internal metrics: cluster health status, IOPS, commit/apply latency, usage, OSD status, etc
- Ceph REST API status: request/response time, success rate, upload/download latency and bandwidth, slow requests, per-node stats, per-bucket stats, etc
2. Design and Implementation
2.1 Collect Internal Metrics
Internal metrics could be retrieved through ceph commands, for example, ceph -s
or ceph status describes ceph cluster healthy status. We developed
a command line tool called ceph-collector to get those info by executing ceph
commands (specifying json output).
ceh-collector is similar to ceph-exporter[1] in concept, but we write
directly to influxdb rather than promethues. Part of the initial code was based
on telegraf ceph input collector [2].
2.2 Collect Requests Information
Ceph provides REST API for uploading, downloading and deleting files. RGW (Rados
Gateway) handles all the requests, which internally uses civetweb - an
embedded web server.
Most oftenly, requests info is recorded in a web servers’ access log, for
civetweb, however, the log has little information. So, we added nginx as a
reserver proxy sitting before RGW, and
customized the nginx configuration to export info we needed.
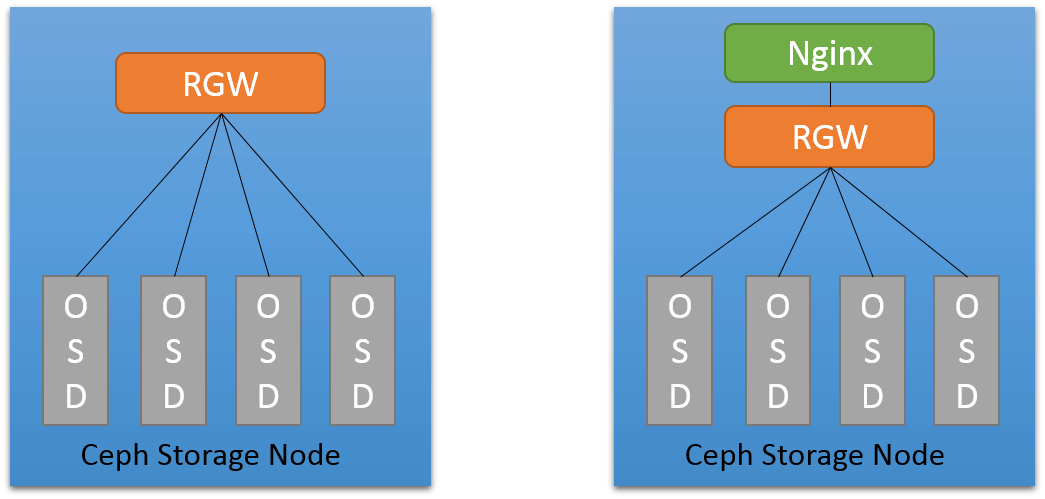
Non-extensive tests show that adding nginx introduced little performance drop.
2.3 Overall Monitoring Solution
The overall solution consists of following components:
- Telegraf - collect requests details from nginx access log
- ceph-collector - collect ceph internal metrics by ceph CLI interfaces
- Influxdb - time series database, storing collected data points
- Grafana - dashboard
- RunDeck - alerting
3 Implementation
3.1 ceph-collector
Implemented in go and built to a binary. Run every 5 minutes and write data directly to influxdb.
Data collecting code initially based on telegraf ceph input, then added some new
metrics and removed some old ones. Support configuration and logging, each
default to /etc/ceph-collector/conf.json and
/etc/ceph-collector/ceph-collector.log.
3.2 Reverse Proxy
Ceph Conf
Change litsening port to 8080, and swift storage URL to nginx listening URL:
rgw_frontends = civetwebport = 8080
swift_storage_url="http://<url>"
Nginx Conf
Except listening on 80 and forwarding all requests to 8080, nginx conf should also be carefully tuned:
1. access log format
Should include additional fields, e.g response time, upload size, download size
log_format  main  '$remote_addr - $remote_user [$time_local] "$request" '
                  '$status $request_length $body_bytes_sent "$http_referer" '
                  '"$http_user_agent" "$http_x_forwarded_for" "$request_time"';

access_log  /var/log/nginx/access.log  main;
error_log  /var/log/nginx/error.log warn;
2. disable request buffering
# this is necessary for disabling request buffering in all cases
proxy_http_version 1.1;
3. body size set to unlimited as there are large file uploads/downloads
# disable any limits to avoid HTTP 413 for large image uploads
client_max_body_size 0;
4. disallow nginx to modify URI (e.g. nginx default will merge double slashs)[3][4]
proxy_pass http://radosgw;
3.3 Collect Requests Info
We use telegraf input parser to match and split request’s fields from nginx access log. Output to influxdb directly.
4 Monitoring Dashboard
We group the monitoring metrics into 4 parts:
- Nginx (REST API Status)
- Error Responses (4xx, 5xx)
- Slow Uploads/Downloads
- Ceph internal Metrics
- Nginx Requests Details
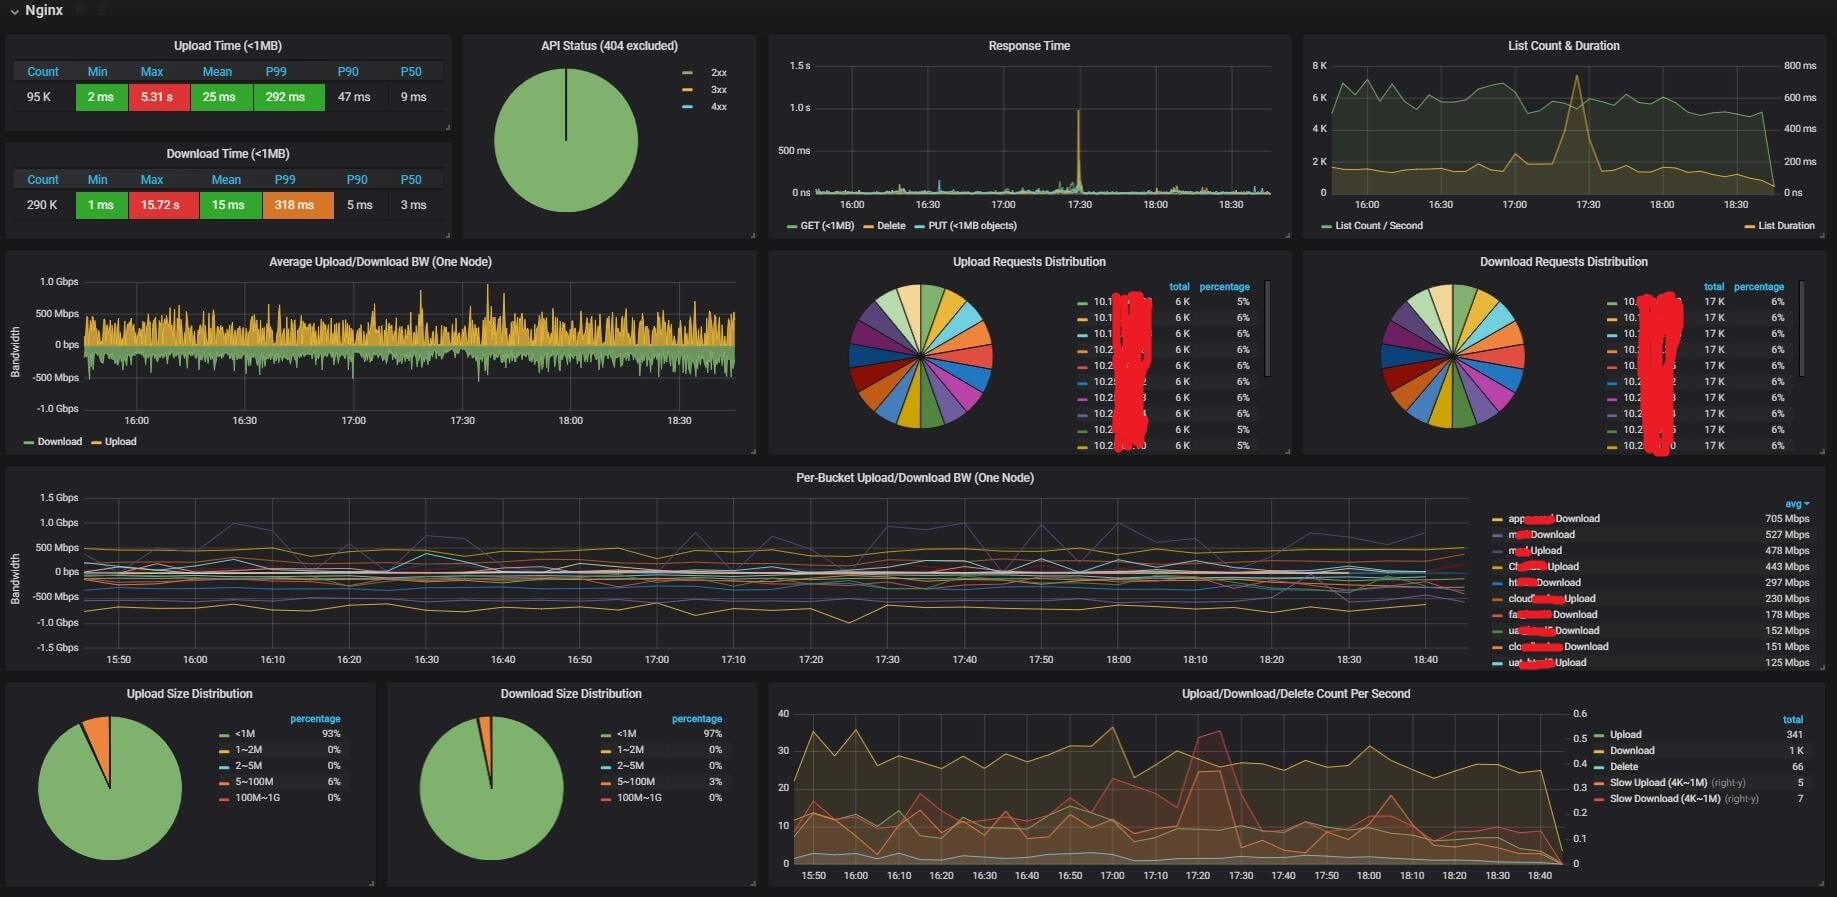
4.1 Nginx
4.1.1 upload/download latency
- statistics: max, min, average, P99, P90, P50.
- response time graph: upload, download, delete, list
- list count, list latency: list operation is time-consuming in distributed object storage systems
The latency metrics filtered out requests with body size larger than 1MB, since we observiced that 98% objects in our cluster are below the size.
4.1.2 API status
- API success rate
- 4xx and 5xx count
4.1.3 upload/download requests
- upload/download count, and slow upload/download count
- requests and slow requests distribution over storage nodes
- upload/download size distribution
4.1.4 upload/download bandwidth
per-bucket and total bandwidth.
4.1.5 Sum Up
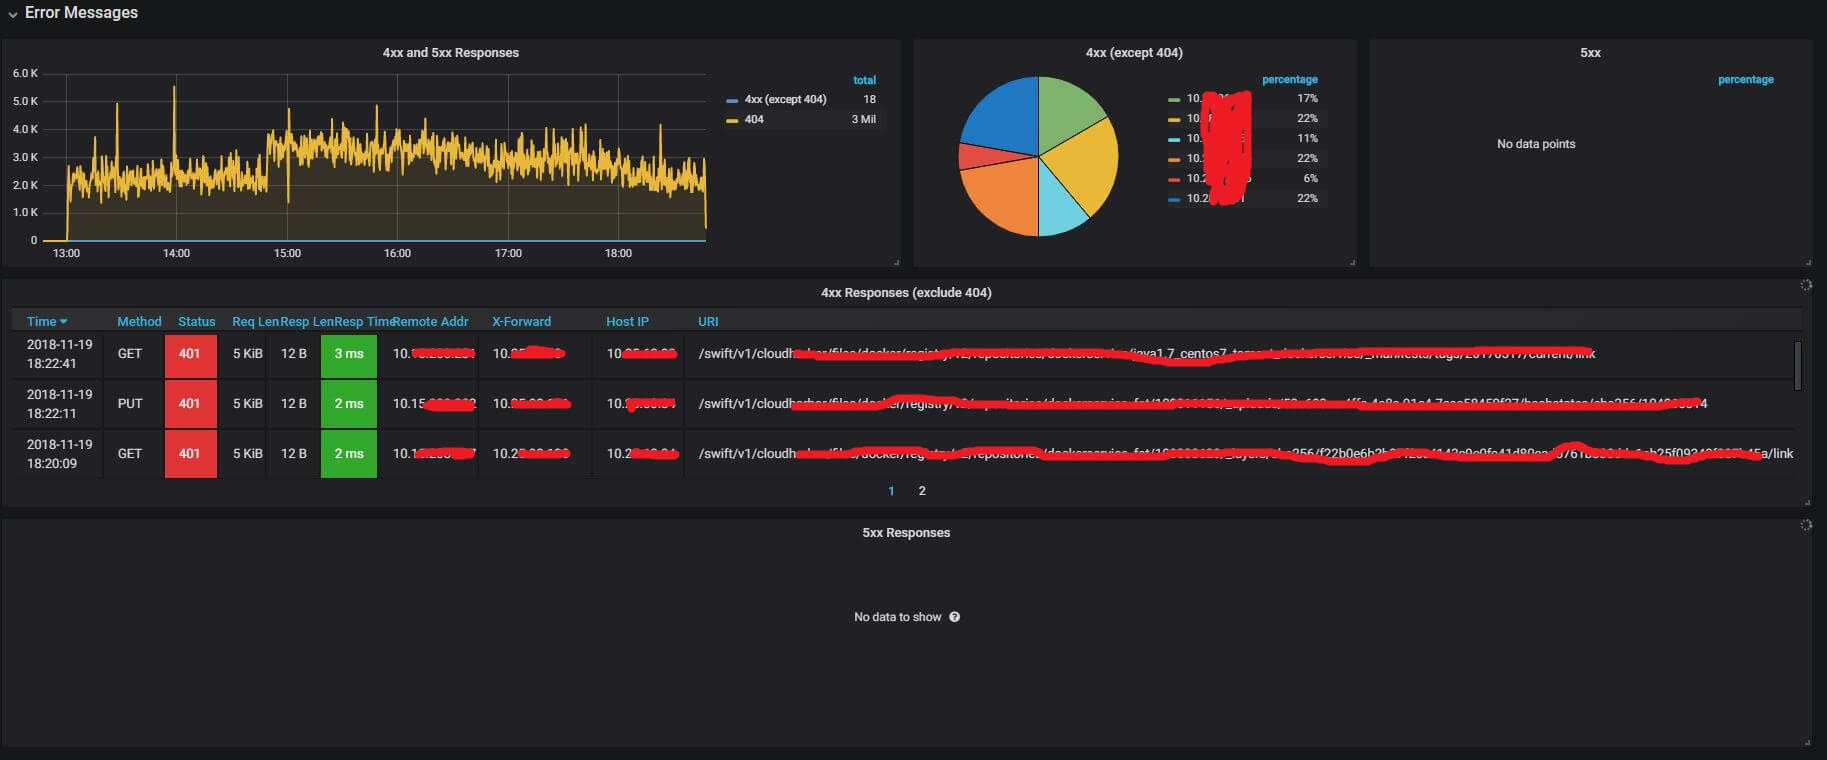
4.2 Error Responses Details
This part shows request/response details of:
- 4xx requests/responses: client side request error
- 5xx requests/responses: internal server error
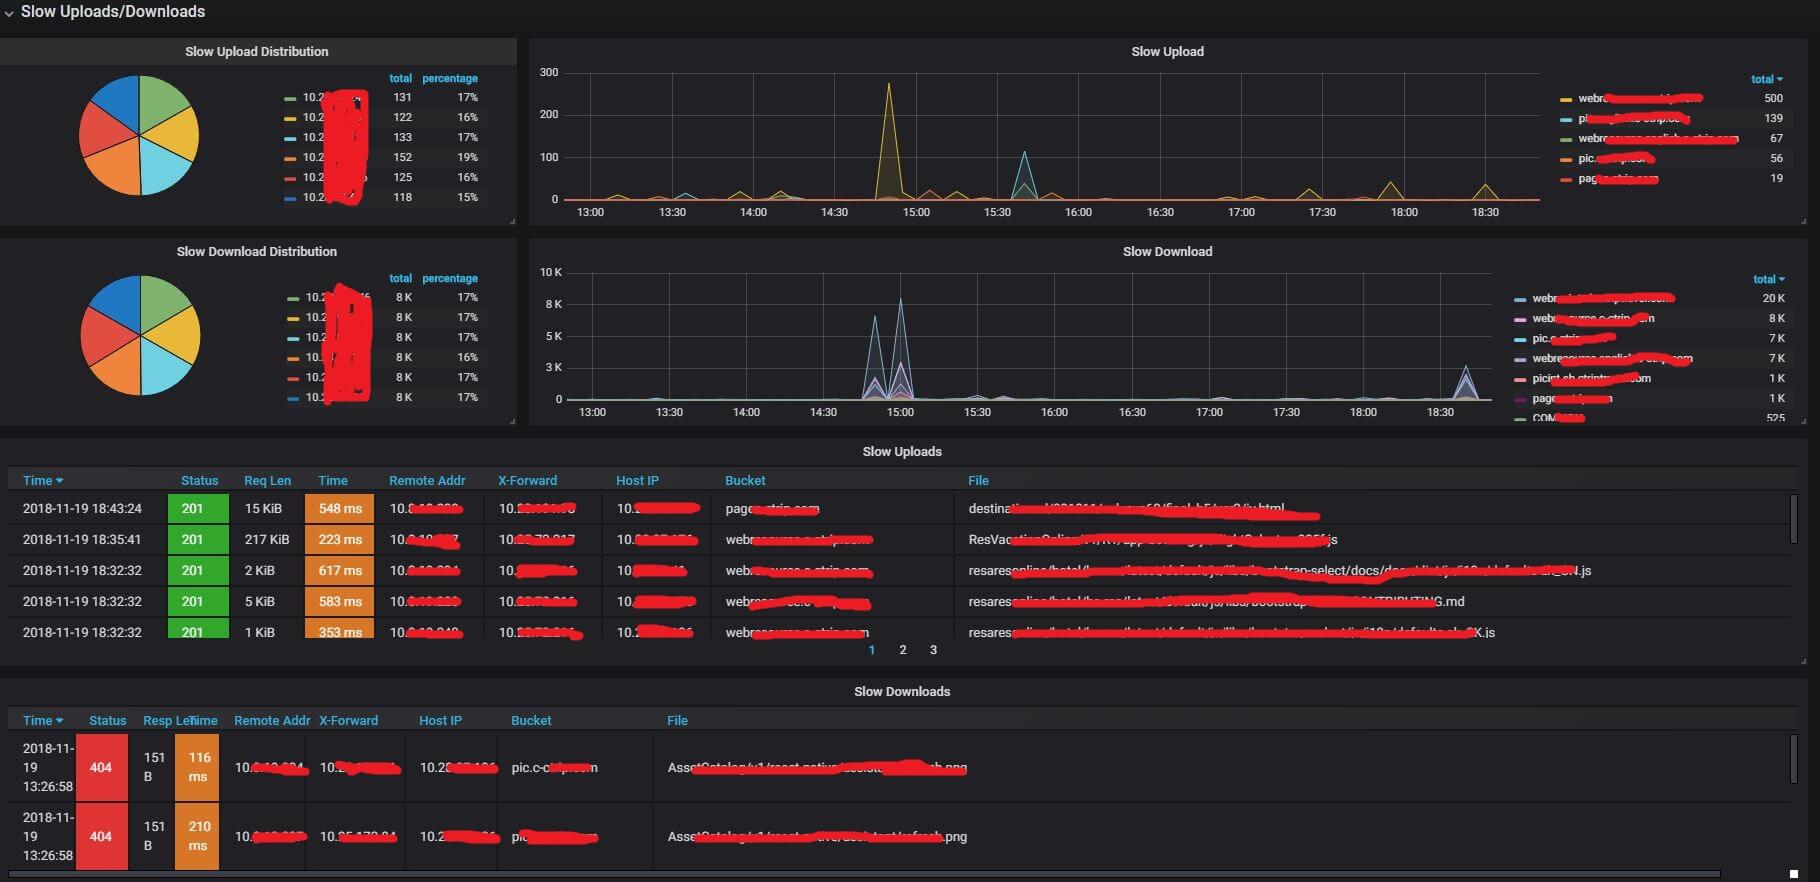
4.3 Slow Uploads/Downloads
- slow uploads requests/responses: slow upload requests
- slow download requests/responses
4.4 Ceph Internal Metrics
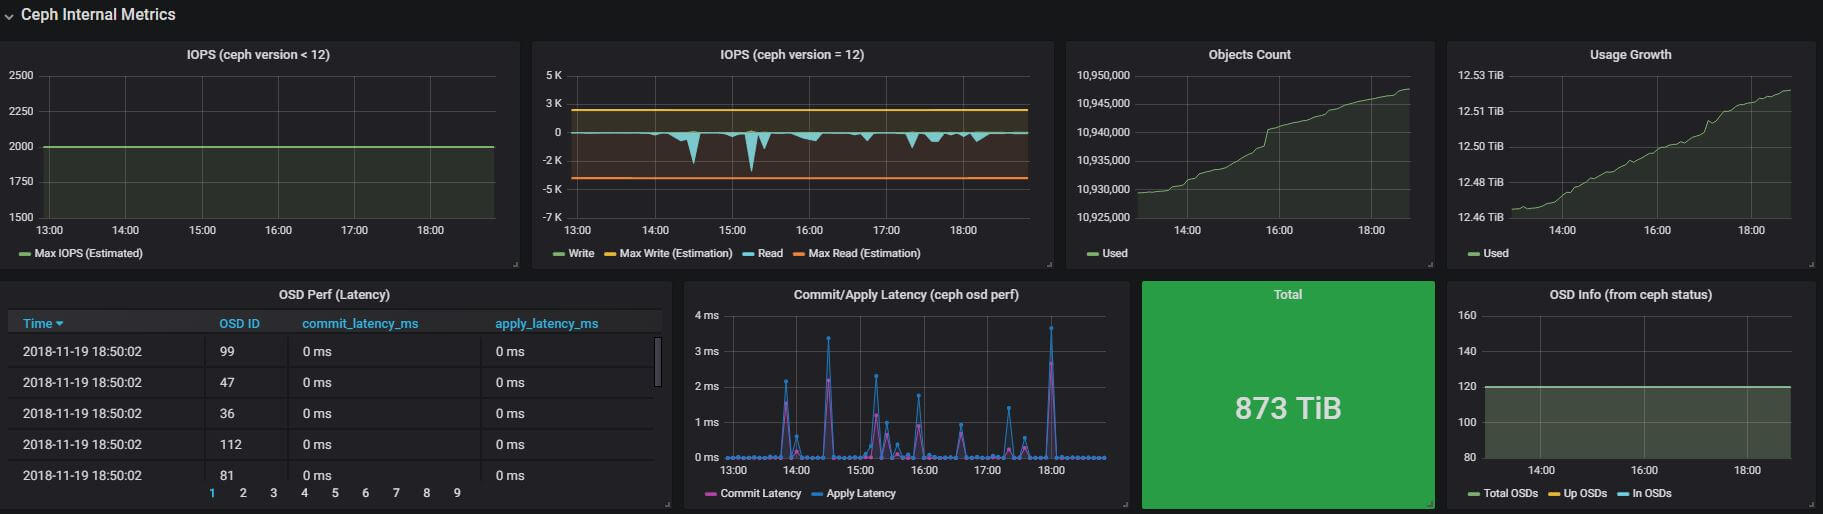
4.4.1 Ceph healthy status
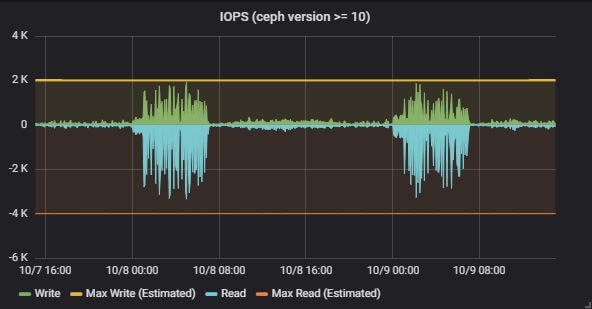
4.4.2 IOPS: read, write
Except the IOPS stats from ceph, we also predicted the upper bound of read and write IOPS. The write uppper bound is calculated with following formula (we got the initial model from ebay, and improved it):
upper bound = <total_osd> * <max_write_iops_per_osd> / <replica> / <write_times>

max_write_iops_per_osd = 100  # 100 IOPS is a moderate value for SATA
replica = 3                   # 3 replication
write_times = 2               # filestore will first write journal, then write to disk
Max read IOPS is similar, but it doesn’t need to the write_times factor.
The predicted uppper bounds fit nicely to our observed data:
4.4.3 Usage
Total size, used size, total objects, and their growth over time.
4.4.4 Commit/Apply latency
4.4.5 OSD status
Monitoring total OSDs, in OSDs, and up OSDs.
4.4.6 Recovery status
Degraded PGs, misplaced PGs, etc
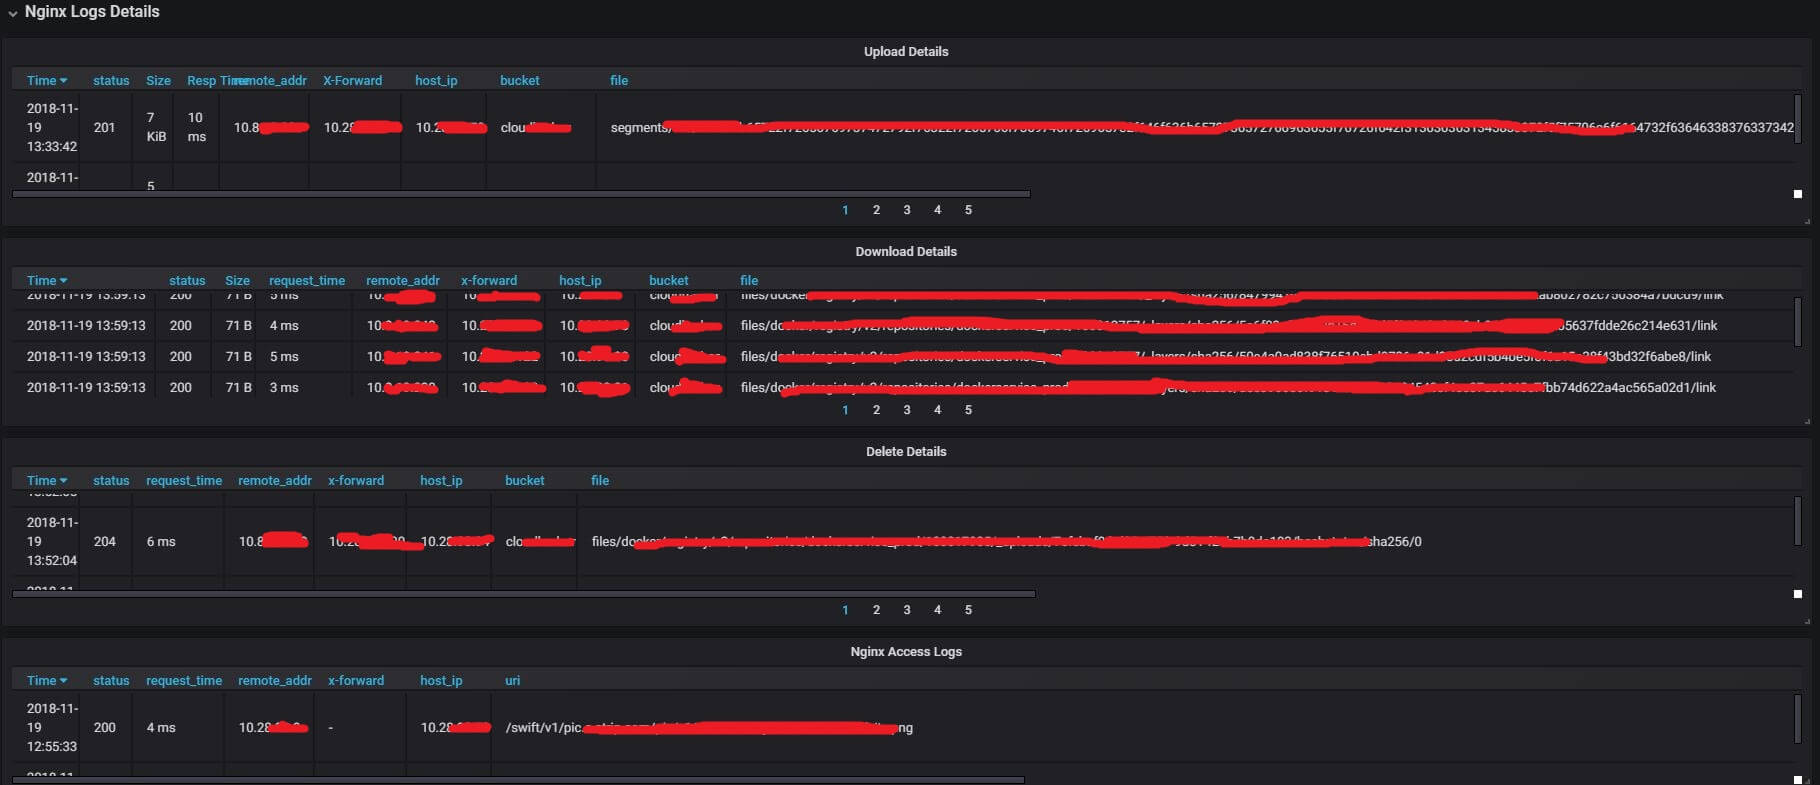
4.5 Nginx Details
Details requests/responses:
- upload requests
- download requests
- delete requests
5 Alerting
To notify our developers in the first time when the ceph cluster misbehaves, we configure alerting rules based on our monitoring metrics.
5.1 Alerting on Ceph un-healthy
5.2 Alerting on OSD down
5.3 Alerting on 5xx Responses
5.4 Nomarl physical server alertings
We also have many alerting rules for the ceph nodes: swap space, memory, bandwidth, etc. But this is done by another monitoring system in our corporation, so we do not detail them here.
6 Summary and Future Work
In this article we proposed an monitoring solution for ceph object storage service. We implemented the solution with the help of some popular open source components. We also developed a command line tool to collect ceph internal metrics. The final monitoring system is fairly helpful to our R&D and DevOps team, relying on which we have found many bottlenecks of the cluster, and done corresponding optimizations, the cluster performance has increased ~40% since then (maybe another dedicated blog for performance tuning).
Apart from monitoring, our system also supports alerting. When the cluster encounters problems, such as internal server errors or OSD down, we are notified in the first time through email, which is very helpful for us to minimize service down time.
References
ceph-exporter, https://github.com/digitalocean/ceph_exportertelegraf ceph, https://github.com/influxdata/telegraf/blob/master/plugins/inputs/ceph/ceph.go- https://stackoverflow.com/questions/14832780/nginx-merge-slashes-redirect
- https://stackoverflow.com/questions/20496963/avoid-nginx-decoding-query-parameters-on-proxy-pass-equivalent-to-allowencodeds
Appendix
- Nginx Conf: nginx.conf
- Ceph Conf: ceph.conf
- Telegraf Conf: ceph_nginx.conf
- Grafana Conf: grafana.json