Cilium Code Walk Through: Node & Endpoint Health Probe
This post also provides a Chinese version.
This post belongs to the Cilium Code Walk Through Series.
This post gives a brief introduction to the Cilium health probe stuffs.
Code based on 1.8.4.
TL; DR
Call diagram:
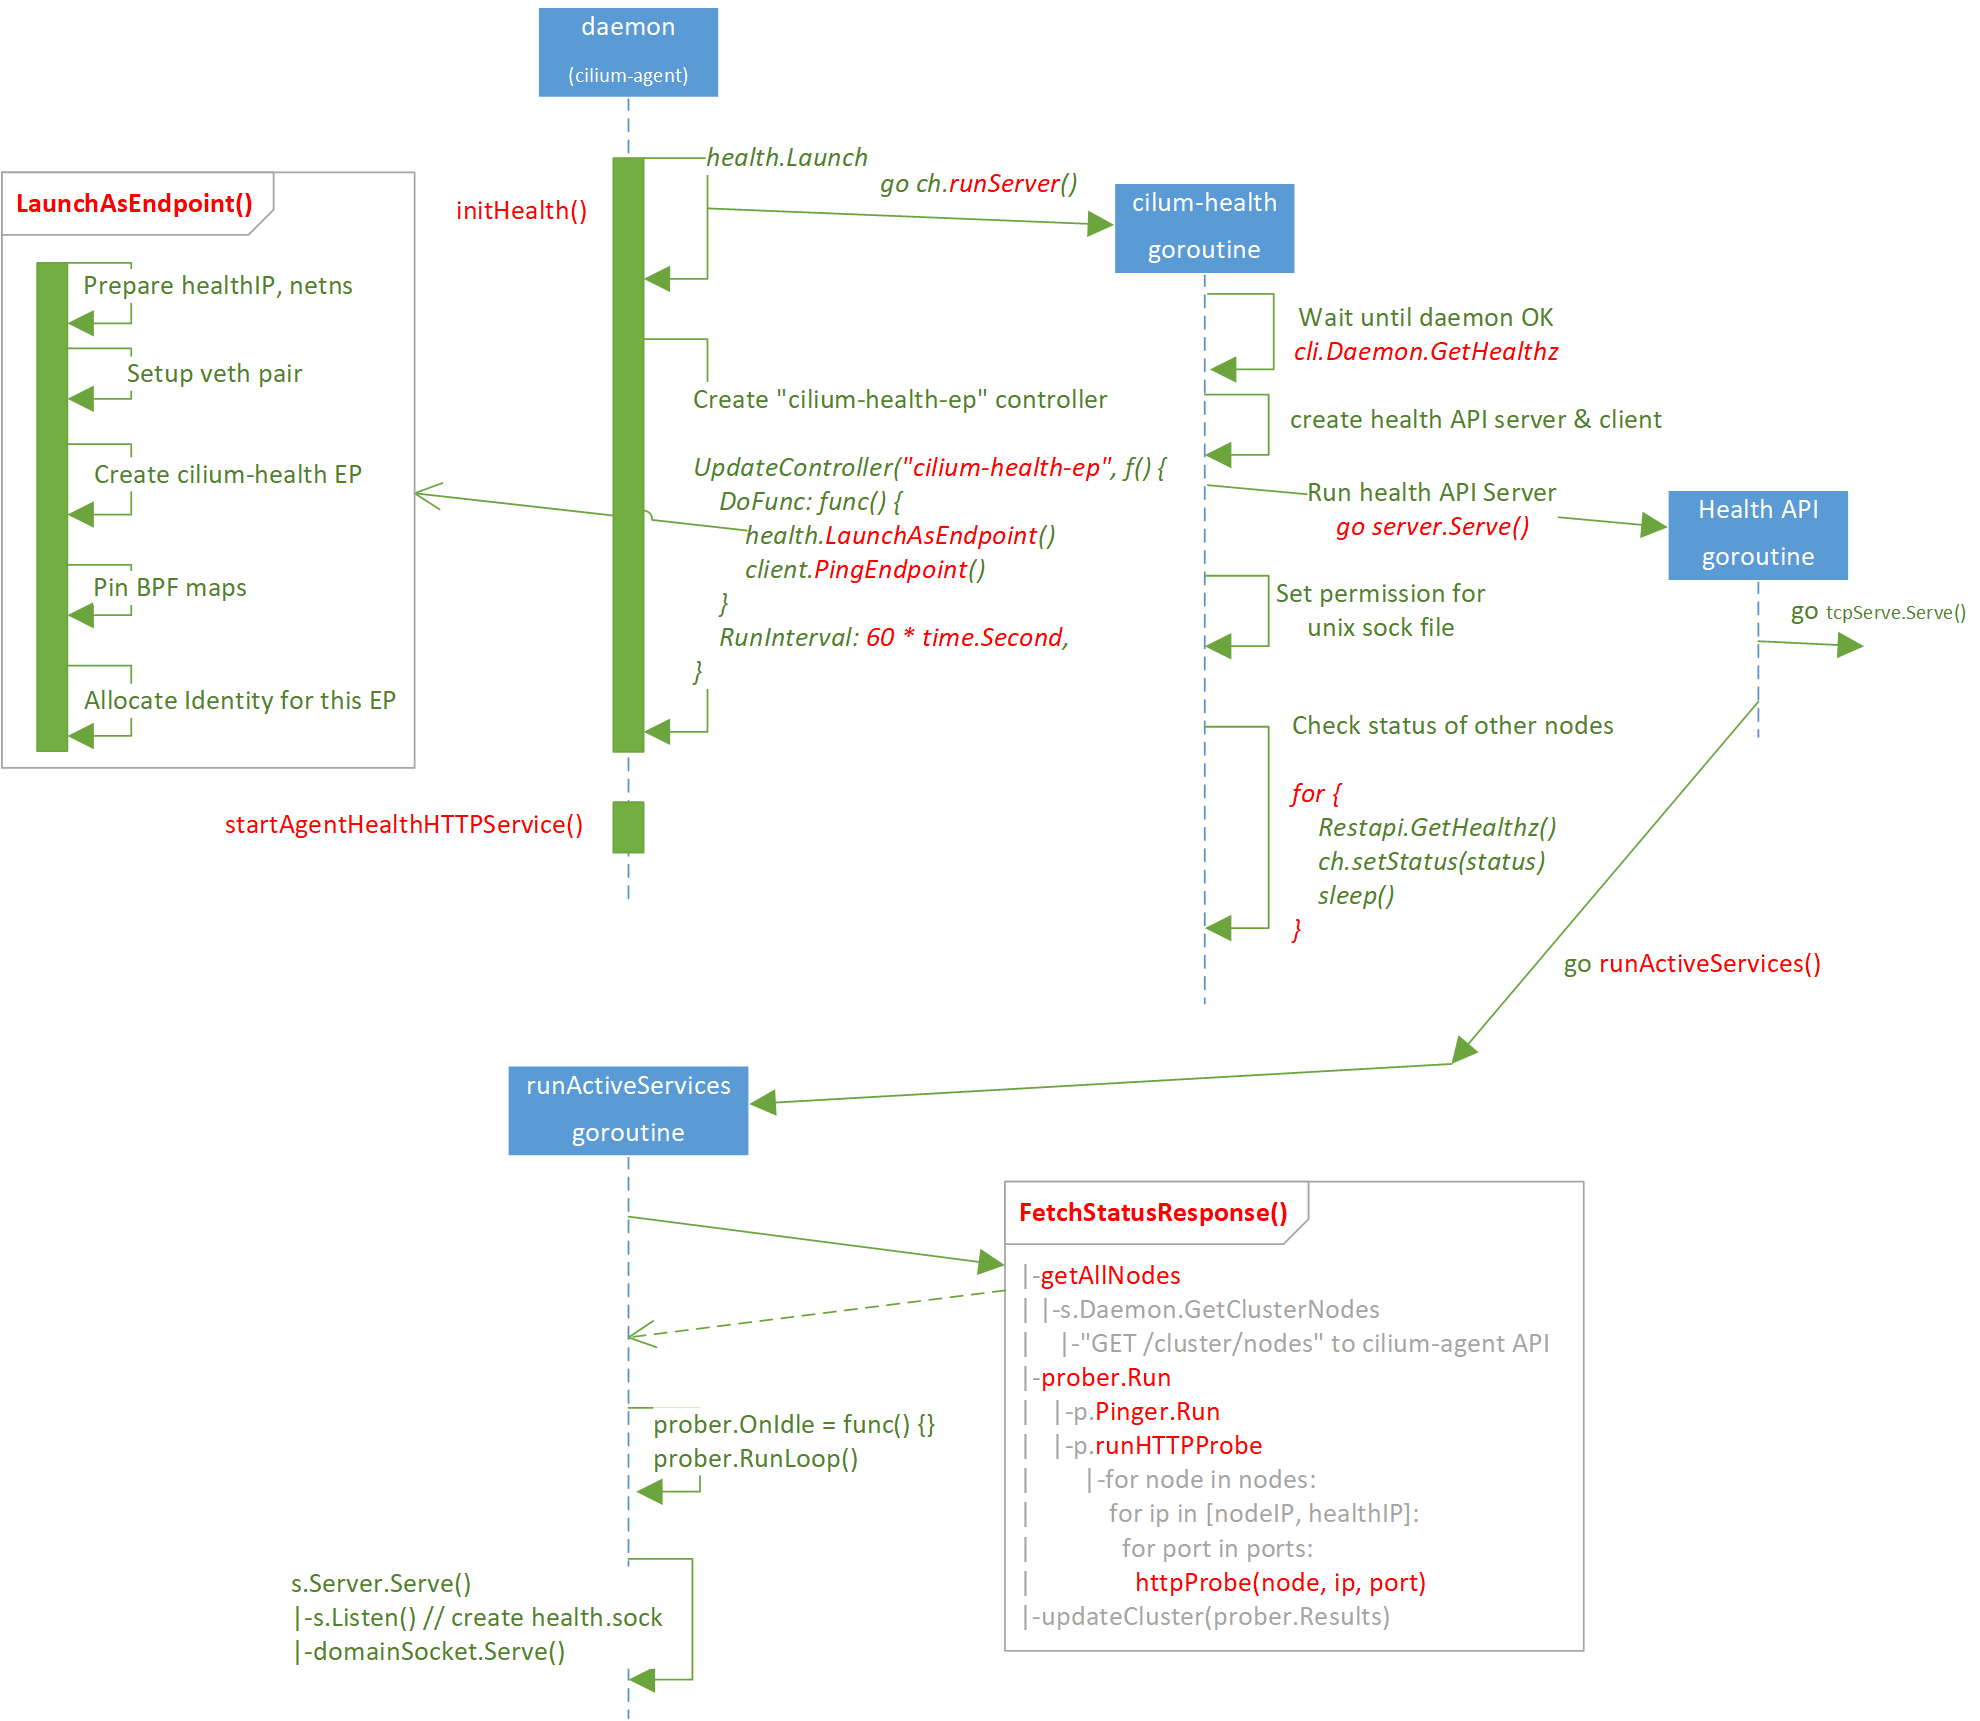
Call stack:
runDaemon                                        // daemon/cmd/daemon_main.go
  |-initHealth                                   // daemon/cmd/health.go
  |  |-health.Launch                             // cilium-health/launch/launcher.go
  |  |  |-ch.server = server.NewServer()
  |  |  |             |-newServer
  |  |  |                |-api := restapi.NewCiliumHealthAPI
  |  |  |                |-srv := healthApi.NewServer(api)
  |  |  |-ch.client = client.NewDefaultClient()
  |  |  |-go runServer()                         // cilium-health/launch/launcher.go
  |  |      |-go ch.server.Serve()
  |  |      |     |-for { go tcpServer.Serve() }
  |  |      |     |-go runActiveServices()
  |  |      |           |-s.FetchStatusResponse
  |  |      |           |   |-getAllNodes
  |  |      |           |   | |-s.Daemon.GetClusterNodes
  |  |      |           |   |    |-"GET /cluster/nodes" to cilium-agent API
  |  |      |           |   |-prober.Run
  |  |      |           |   |   |-p.Pinger.Run
  |  |      |           |   |   |-p.runHTTPProbe
  |  |      |           |   |        |-for node in nodes:
  |  |      |           |   |            for ip in [nodeIP, healthIP]:
  |  |      |           |   |              for port in ports:
  |  |      |           |   |                httpProbe(node, ip, port) // port=4240
  |  |      |           |   |-updateCluster(prober.Results)
  |  |      |           |-s.getNodes
  |  |      |           |-prober.OnIdle = func() {
  |  |      |           |   updateCluster(prober.Results)
  |  |      |           |   nodesAdded, nodesRemoved := getNodes()
  |  |      |           |     |-s.Daemon.GetClusterNodes
  |  |      |           |        |-"GET /cluster/nodes" to cilium-agent API
  |  |      |           |   prober.setNodes(nodesAdded, nodesRemoved)
  |  |      |           | }
  |  |      |           |-prober.RunLoop
  |  |      |           |-s.Server.Serve()  // api/v1/health/server/server.go
  |  |      |              |-s.Listen()     // listen at unix://xxx/health.sock
  |  |      |              |-if unix sock:
  |  |      |                  |-domainSocket.Serve(l)
  |  |      |-for {
  |  |          ch.client.Restapi.GetHealthz()
  |  |          ch.setStatus(status)
  |  |        }
  |  |
  |  |-pidfile.Remove("/var/run/cilium/state/health-endpoint.pid")
  |  |-UpdateController("cilium-health-ep", func() {
  |      DoFunc: func() {
  |          LaunchAsEndpoint
  |          RunInterval: 60 * time.Second,
  |      }
  |    })
  |
  |-startAgentHealthHTTPService                 // daemon/cmd/agenthealth.go
      |- mux.Handle("/healthz")
1 Design
1.1 Full-mesh probe
By design, each Cilium node can actively probe all other nodes about their health statuses, and in this way each node always keeps a fresh view of the global health status of the cluster.
As each node will probe all other nodes, the probing paths turn out to be a full-mesh network, as shown below:
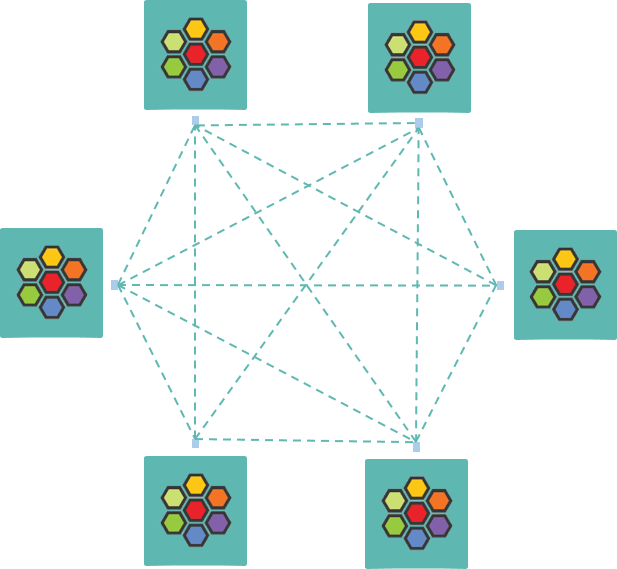
Fig. Full-mesh health probing of Cilium nodes
The probing behavior is controlled by two options in cilium-agent, both with default true:
enable-health-checking: probe the status of other nodes.enable-endpoint-health-checking: probe the status of thecilium-health-epon other nodes. We will detail oncilium-health-eplater.
1.2 Types of probes
Speaking from the viewpoint of network layers, there are two kinds of probes:
- L3 probe:
ping(ICMP) - L7 probe:
GET <HTTP API>
And by combining the two options, there are 4 types of probes in total:
-
enable-health-checking=true:- ICMP probe (L3):
ping <NodeIP> - HTTP probe (L7):
GET http://<NodeIP>:4240/hello
- ICMP probe (L3):
-
enable-endpoint-health-checking=true:- ICMP probe (L3):
ping <HealthIP> - HTTP probe (L7):
GET http://<HealthIP>:4240/hello
- ICMP probe (L3):
1.3 Probe results
The agent stores the probe results to a local cache, and we can retrieve it via CLI:
(node1) $ cilium-health status
Probe time:   2020-12-29T15:17:02Z
Nodes:
  cluster1/node1 (localhost):
    Host connectivity to 10.5.6.60:        # <-- NodeIP
      ICMP to stack:   OK, RTT=9.557967ms
      HTTP to agent:   OK, RTT=405.072µs
    Endpoint connectivity to 10.6.2.213:   # <-- HealthIP
      ICMP to stack:   OK, RTT=9.951333ms
      HTTP to agent:   OK, RTT=468.645µs
  cluster1/node2:
    ...
  cluster2/node100:
    Host connectivity to 10.6.6.100:        # <-- NodeIP
      ICMP to stack:   OK, RTT=10.164048ms
      HTTP to agent:   OK, RTT=694.196µs
    Endpoint connectivity to 10.22.1.3:     # <-- HealthIP
      ICMP to stack:   OK, RTT=11.282117ms
      HTTP to agent:   OK, RTT=765.092µs
If clustermesh is enabled, cilium-agent will also probe the nodes that are in other K8s clusters inside the clustermesh, that’s why we can see nodes from different clusters in the above output.
1.4 A special endpoint: cilium-health-ep
In its simple way, cilium-agent creates an Endpoint
for each Pod on the node. cilium-health-ep is a special Endpoint:
(node) $ cilium endpoint list
ENDPOINT   POLICY (ingress)   POLICY (egress)   IDENTITY   LABELS (source:key[=value])  IPv4         STATUS
...
2399       Disabled           Disabled          4          reserved:health              10.6.2.213   ready
...
It is not a Pod, but as we can see, it has its own
- Endpoint ID: randomly allocated by cilium-agent, unique within each node.
- Identity: fixed value
4, which belongs to the reserved identity set. And that means,cilium-health-epon each node has the same identity value4. - IP address: randomly allocated by cilium-agent.
- Veth pair:
lxc_health@<peer>
We could also check the IP address of cilium-health-ep with the following command:
$ cilium status --all-addresses | grep health
  10.6.2.213 (health)
1.5 Summary
From the above discussions we can conclude that the health probe mechanism in Cilium is simple and straight forward.
But when it comes to implementation, things become complicated.
2 Implementation
The entire flow diagram and calling stack has been given at the very beginning of this post. In the next, let’s walk through them steps by steps.
2.1 Initialization: high level overview
Starting from the initialization of cilium-agent daemon.
Major steps:
-
Call
initHealth(), most of the remaining work will be done here.- Init prober, probe all other nodes sequentially.
- Launch cilium-health-ep. This step doesn’t wait for the above step’s finishing, they are independent steps.
-
Register cilium-agent
/healthzAPI and start serving this API.- This API reports cilium-agent health status.
cilium status --briefinternally calls this API.
One important thing to note is that, initHealth() creates many goroutines to
initalize the health subsystem (including the sequential probing to all nodes),
and /healthz API doesn’t wait former’s finishing.
So usually cilium-agent /healthz API quickly becomes ready and returns OK if
you GET it, but the health probing to all nodes may take several seconds,
minutes, or even hours.
As most of the heavy work is done in initHealth(), let dig inside.
2.2 initHealth() -> Launch() -> runServer() -> server.Serve()
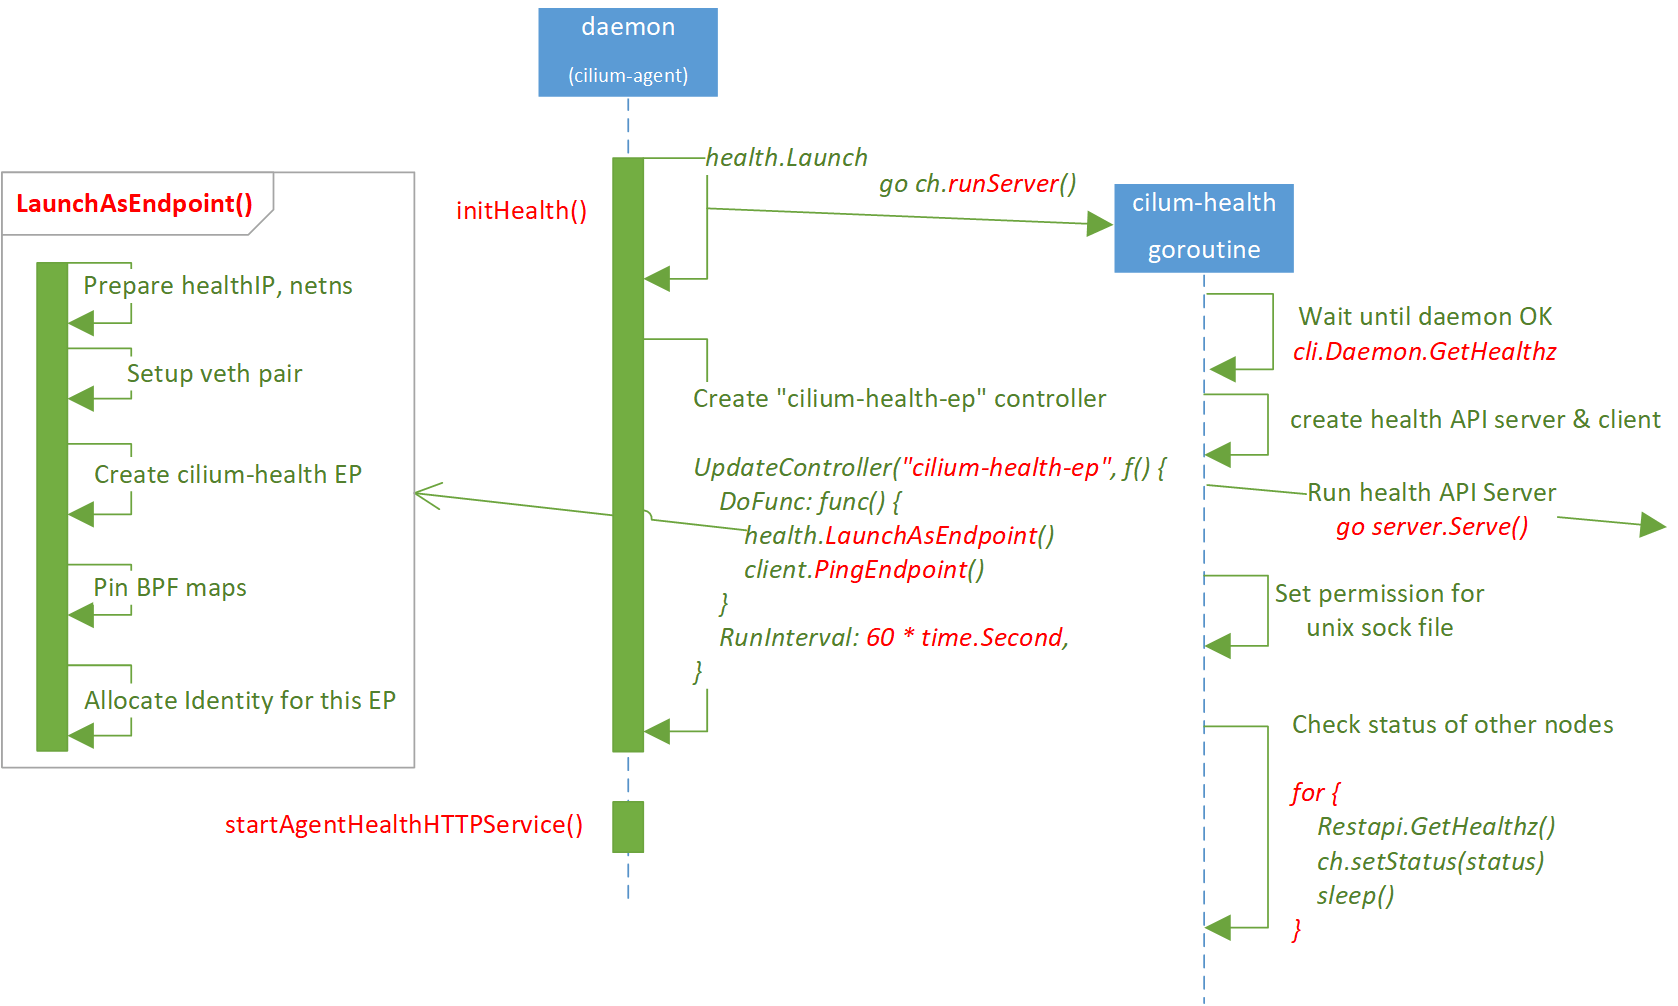
Steps in initHealth():
-
Call
health.Launch(), the latter performs- Init
ch.server - Init
ch.client - Call
go ch.runServer(), most of the remaining work will be done there.
- Init
- Remove stale pid file (
/var/run/cilium/state/health-endpoint.pid) -
Create
cilium-health-epcontroller (periodic task), the latter will perform- Create
cilium-health-epEndpoint, - Make ensure
cilium-health-epis alive, recreate it if needed
- Create
Then let’s see the heavy work in go ch.runServer().
2.3 runServer()
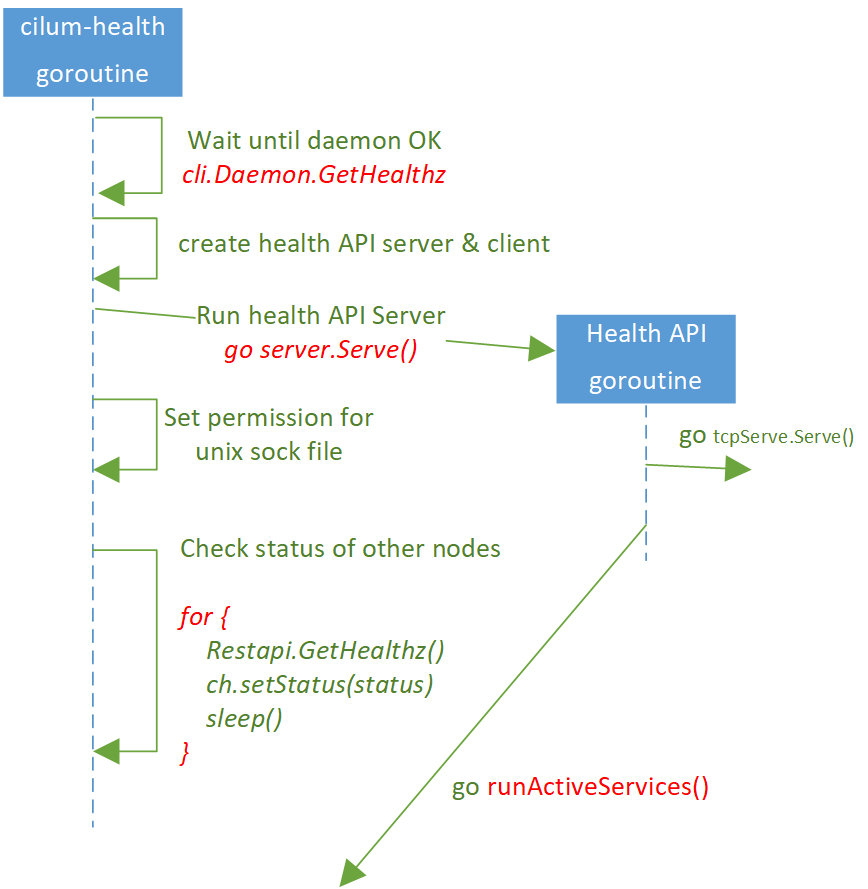
Code at cilium-health/launch/launcher.go.
Steps:
- Wait cilium-agent starts successfully (repeatedly
GET /healthzuntil OK) - Remove stale sock file
/var/run/cilium/health.sock. When you executecilium-healthcommand, it will send requests to this sock. -
Call
go ch.server.Serve(): start cilium-health API server in a new goroutine,- Spawn TCP servers goroutines
- Spawn a goroutine to run
runActiveServices(). This will create the prober and unix/http/https servers, and the unix server will re-create thehealth.sockfile at itsListen()method.
-
Blocking until new
health.sockfile is ready, then set permission for this file. - Periodically
GET /healthzfrom ciliu-agent, and cache the result to daemon.
ch.server.Serve():
// pkg/health/server/server.go

// Serve spins up the following goroutines:
// * TCP API Server: Responders to the health API "/hello" message, one per path
// * Prober: Periodically run pings across the cluster, update server's connectivity status cache.
// * Unix API Server: Handle all health API requests over a unix socket.
func (s *Server) Serve() (err error) {
    for i := range s.tcpServers {
        srv := s.tcpServers[i]
        go func() {
            errors <- srv.Serve()
        }()
    }

    go func() {
        errors <- s.runActiveServices()
    }()

    err = <-errors // Block for the first error, then return.
    return err
}
Most of the remaing work will be done in runActiveServices().
2.4 runActiveServices()
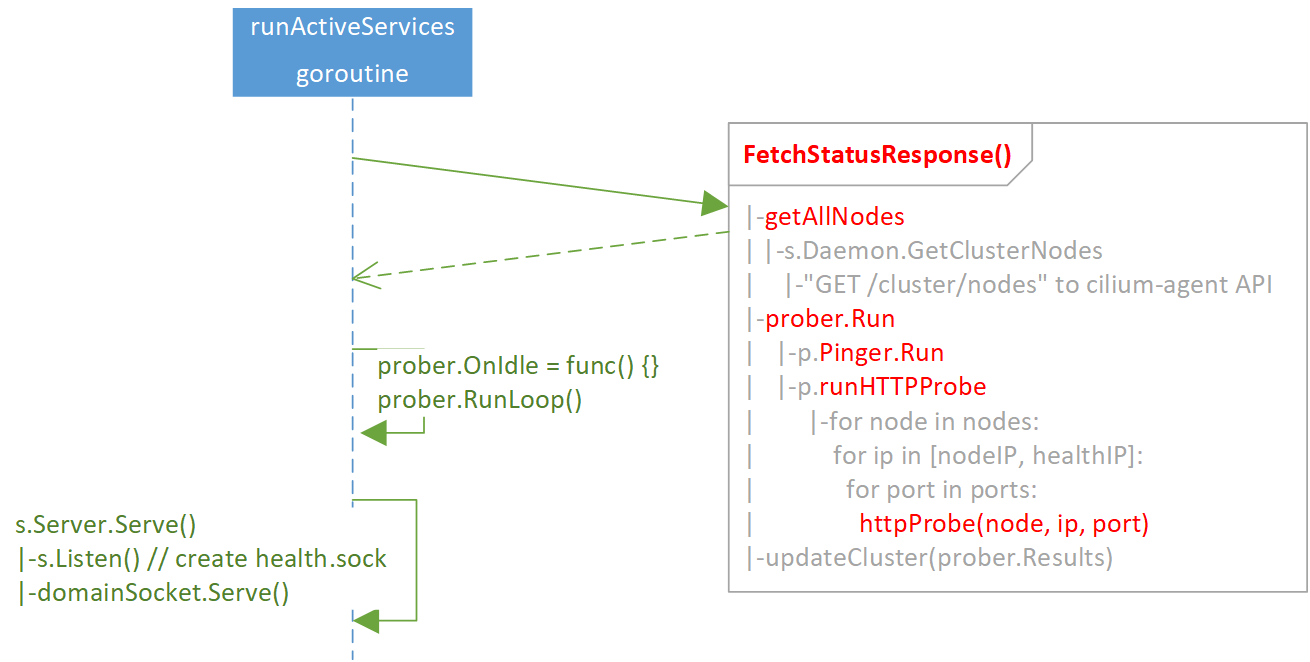
Steps:
- Call
FetchStatusResponse(), which will probe all nodes sequentially. - Set up
OnIdle()handler for the prober, then startprober.RunLoop(), which will periodically update current node set. - Call
s.Server.Seve(), start to serve Unix/HTTP/HTTPS requests.
Note the 1st step,
- The probe process is sequential over all other nodes,
- If a node is not reachable, L7 check will time out after
30s.
So, if there are lots of nodes that not reachable via L7 probe, step 3 would
be delayed. Specifically, we could see the following errors when executing
cilium-health command:
$ cilium-health status
Error: Cannot get status: Get "http://%2Fvar%2Frun%2Fcilium%2Fhealth.sock/v1beta/status": dial unix /var/run/cilium/health.sock: connect: no such file or directory
As this sock file will be created later, in step 3 s.Server.Serve() -> Listen().
Code:
// pkg/health/server/server.go

// Run services that are actively probing other hosts and endpoints over ICMP and HTTP,
// and hosting the health admin API on a local Unix socket.
func (s *Server) runActiveServices() error {
    s.FetchStatusResponse()

    nodesAdded, _, _ := s.getNodes()
    prober := newProber(s, nodesAdded)
    prober.OnIdle = func() {
        // Fetch results and update set of nodes to probe every ProbeInterval
        s.updateCluster(prober.getResults())

        if nodesAdded, nodesRemoved, err := s.getNodes(); err != nil {
            log.WithError(err).Error("unable to get cluster nodes")
        } else {
            prober.setNodes(nodesAdded, nodesRemoved)
        }
    }
    prober.RunLoop()

    return s.Server.Serve()
}
The last line s.Server.Serve() is implemented as:
// api/v1/server/server.go

// Serve the api
func (s *Server) Serve() (err error) {
    if !s.hasListeners
        s.Listen() // net.Listen(s.SocketPath) -> create sock file

    if s.handler == nil // set default handler, if none is set
        s.SetHandler(s.api.Serve(nil))

    if s.hasScheme(schemeUnix) { // "Serving cilium at unix://%s", s.SocketPath
        go func(l net.Listener) {
            domainSocket.Serve(l)
        }(s.domainSocketL)
    }

    if s.hasScheme(schemeHTTP) {
        ...
    }
    if s.hasScheme(schemeHTTPS) {
      ...
    }

    return nil
}
2.5 Launch cilium-health-ep
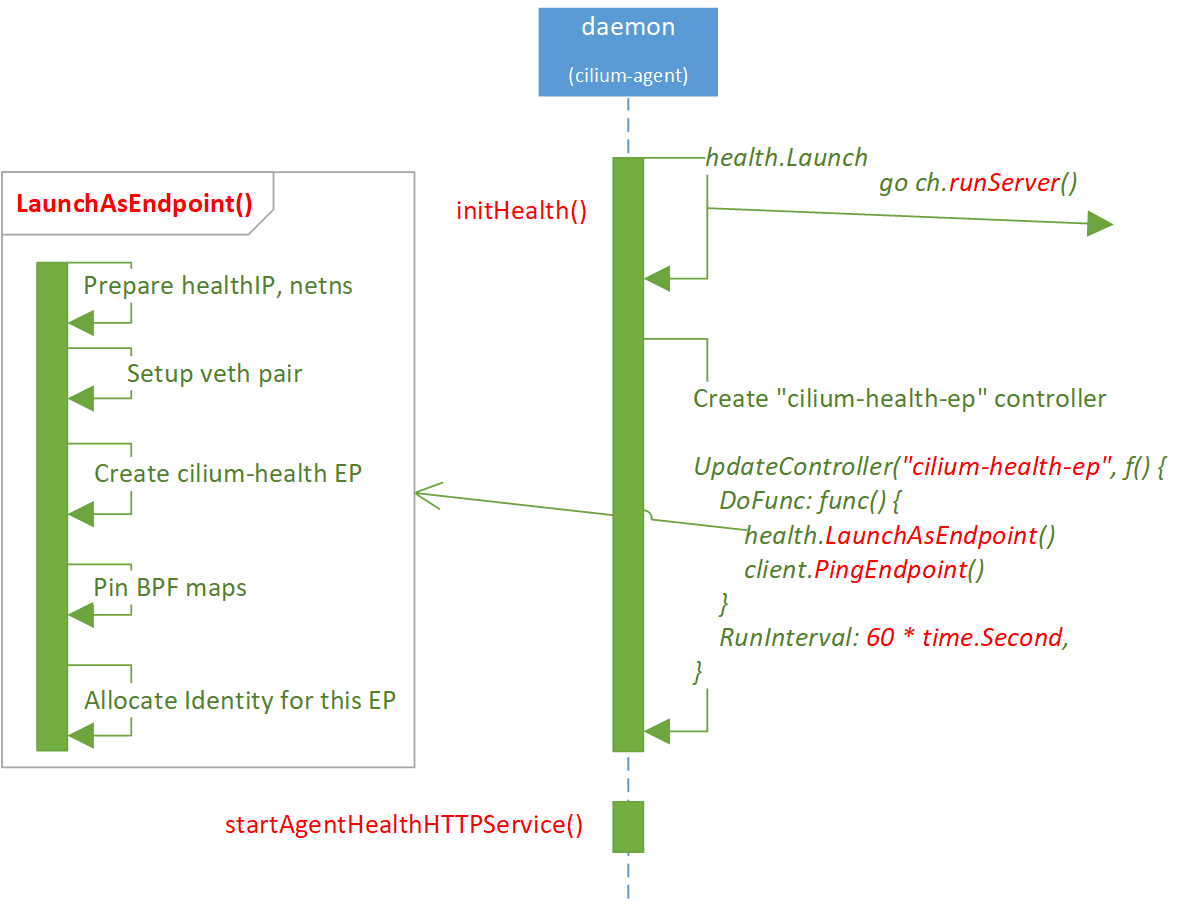
As shown above, creating cilium-health-ep is independent of the steps in
section 2.2~2.4 (the latter is asynchronously executed since go
runServer()).
cilium-health-ep is a Cilium Endpoint, so it will also go through the
following endpoint creating procedure:
- Allocate IP address,
- Create netns,
- Create veth pair (
lxc_health), - Create Endpoint
- Allocate identity: note that in Cilium, identity is allocated after endpoint creation.
- Regenerate BPF
Code: cilium-health/launch/endpoint.go.
3 CLI cheat sheet
Some health related CLIs.
3.1 Check cilium agent status
cilium status --brief: brief output, which internally performs"GET /healthz"cilium status: normal outputcilium status --verbose: verbose output
3.2 Check connectivity results
$ cilium-health status
...

$ cilium status --verbose
...
Cluster health:                          265/268 reachable   (2020-12-31T09:00:03Z)
  Name                         IP                Node          Endpoints
  cluster1/node1 (localhost)   10.5.6.60         reachable     reachable
  cluster2/node2               10.6.9.132        reachable     reachable
  ...
3.3 Check health info in CT/NAT tables
ICMP records in Conntrack (CT) table and NAT table:
$ cilium bpf ct list global | grep ICMP |head -n4
ICMP IN 10.4.9.12:0 -> 10.5.8.4:518 expires=1987899 RxPackets=1 RxBytes=50 RxFlagsSeen=0x00 LastRxReport=1987839 TxPackets=1 TxBytes=50 TxFlagsSeen=0x00 LastTxReport=1987839 Flags=0x0000 [ ] RevNAT=0 SourceSecurityID=2 IfIndex=0
ICMP OUT 10.5.2.101:47153 -> 10.4.9.11:0 expires=1987951 RxPackets=0 RxBytes=0 RxFlagsSeen=0x00 LastRxReport=0 TxPackets=1 TxBytes=50 TxFlagsSeen=0x00 LastTxReport=1987891 Flags=0x0000 [ ] RevNAT=0 SourceSecurityID=0 IfIndex=0

$ cilium bpf nat list | grep ICMP |head -n4
ICMP OUT 10.5.2.101:65204 -> 10.4.6.9:0 XLATE_SRC 10.5.2.101:65204 Created=1987884sec HostLocal=1
ICMP IN 10.4.4.11:0 -> 10.5.2.101:39843 XLATE_DST 10.5.2.101:39843 Created=1987884sec HostLocal=1